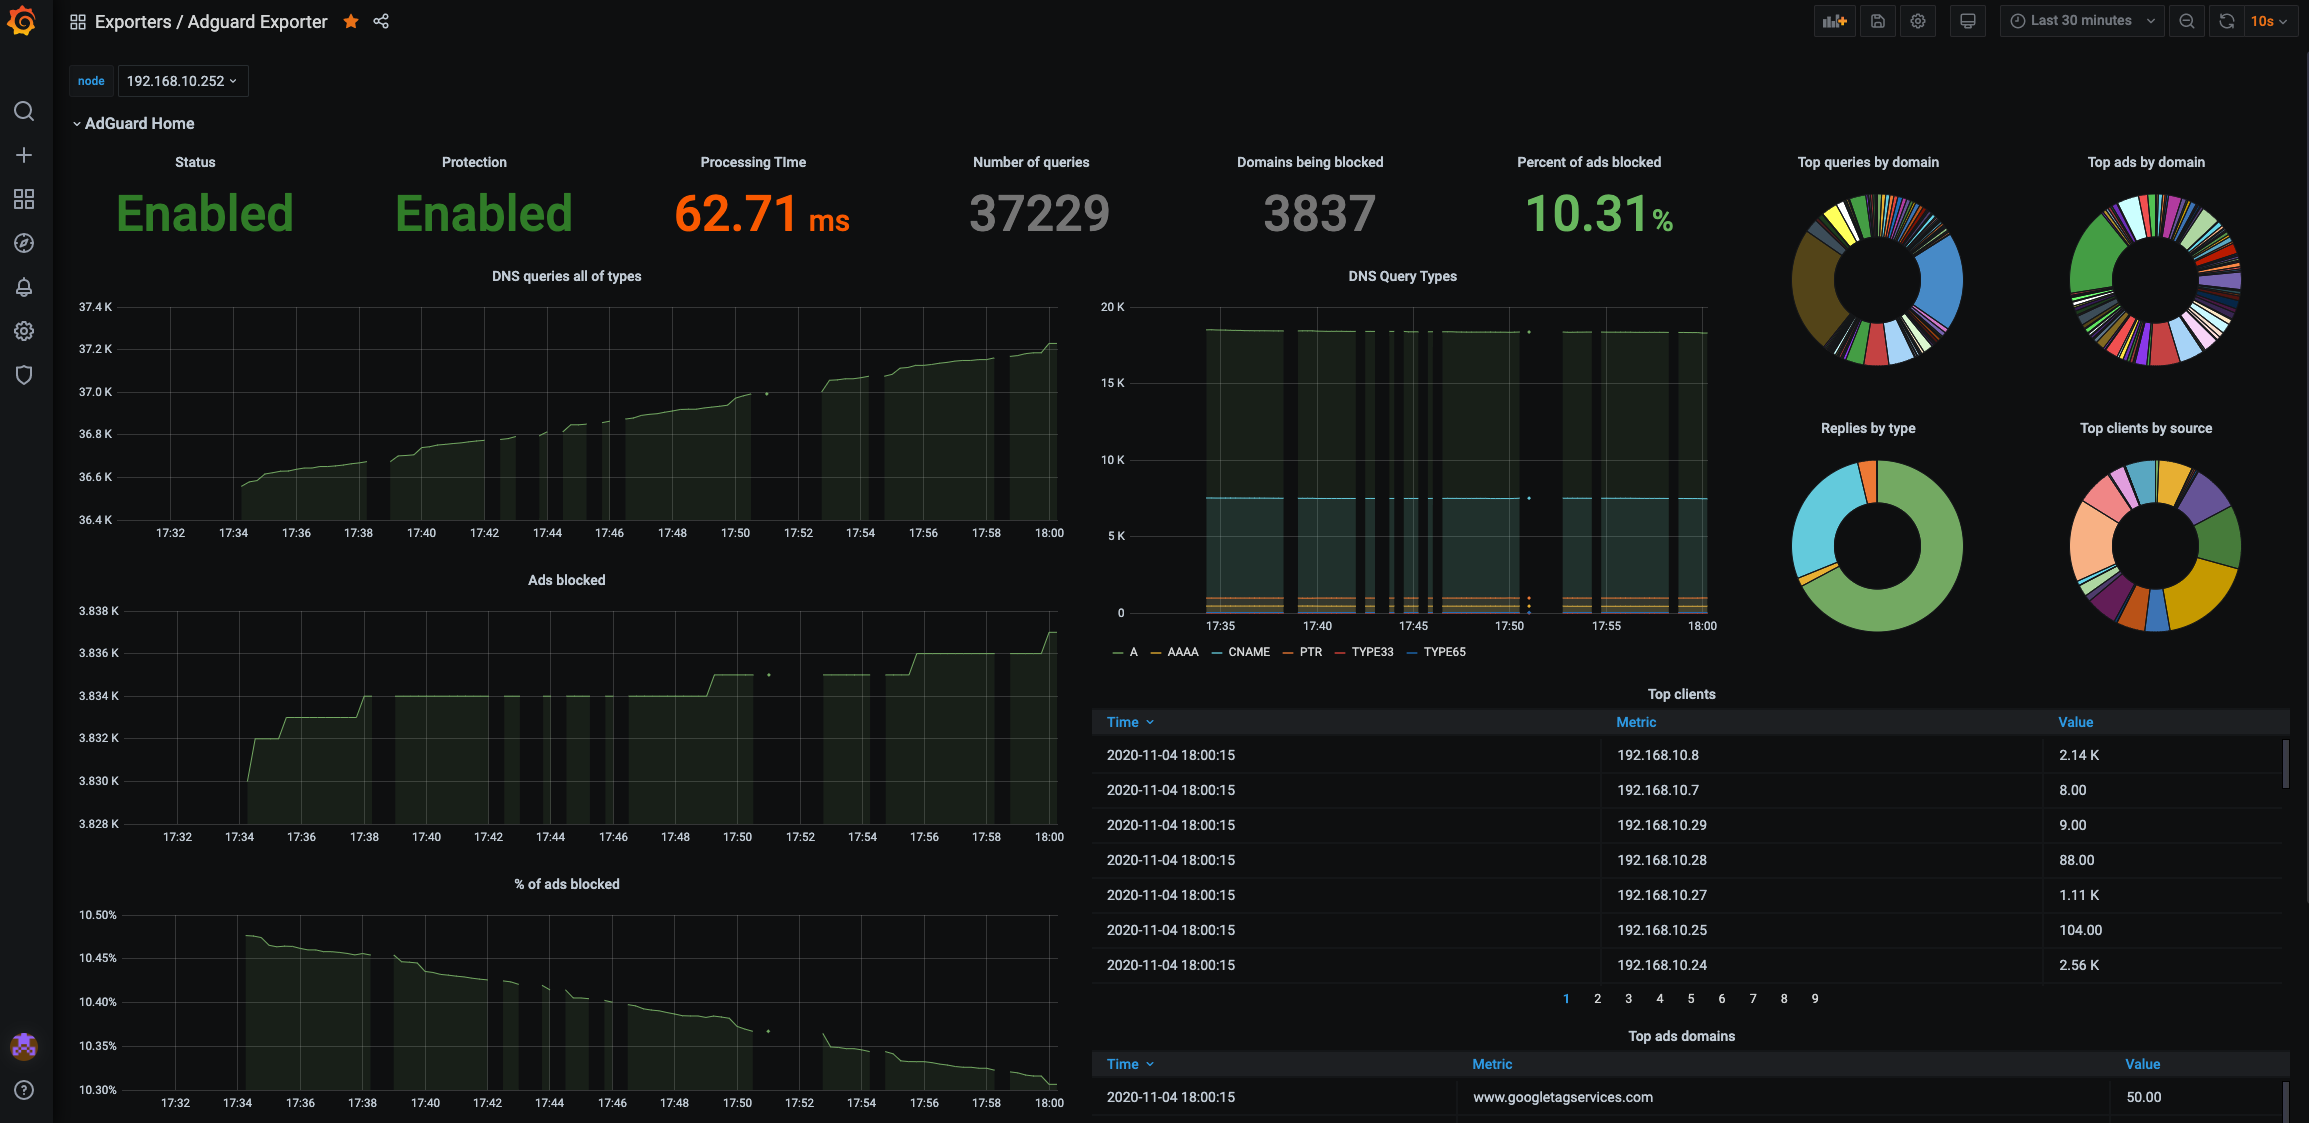
Adguard Exporter
This is a Adguard dashboard when using the https://github.com/ebrianne/adguard-exporter Prometheus exporter
Information
This is a dashboard for AdguardHome's Raspberry PI ad blocker. It is based on the famous pihole dashboard available here.
adguard-exporter sources and binaries are available here: https://github.com/ebrianne/adguard-exporter
Available Prometheus metrics
| Metric name | Description |
|---|---|
| adguard_avg_processing_time | This represent the average DNS query processing time |
| adguard_num_blocked_filtering | This represent the number of blocked DNS queries |
| adguard_num_dns_queries | This represent the number of DNS queries |
| adguard_num_replaced_parental | This represent the number of blocked DNS queries (parental) |
| adguard_num_replaced_safebrowsing | This represent the number of blocked DNS queries (safe browsing) |
| adguard_num_replaced_safesearch | This represent the number of blocked DNS queries (safe search) |
| adguard_top_blocked_domains | This represent the top blocked domains |
| adguard_top_clients | This represent the top clients |
| adguard_top_queried_domains | This represent the top domains that are queried |
| adguard_query_types | This represent the types of DNS queries |
| running | Is Adguard running? |
| protection_enabled | Is the protection enabled? |
Data source config
Collector type:
Collector plugins:
Collector config:
Revisions
Upload an updated version of an exported dashboard.json file from Grafana
| Revision | Description | Created | |
|---|---|---|---|
| Download |
