SSL Certificate Monitor
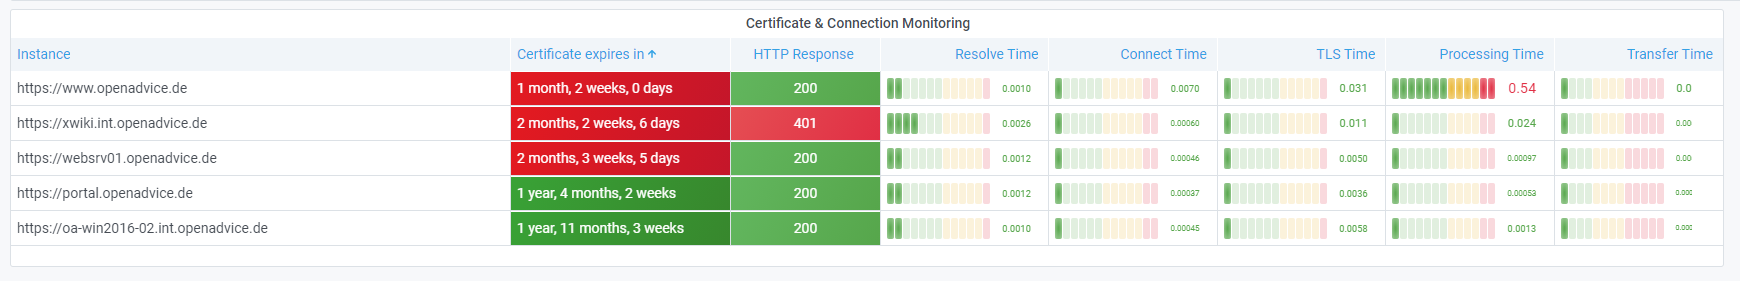
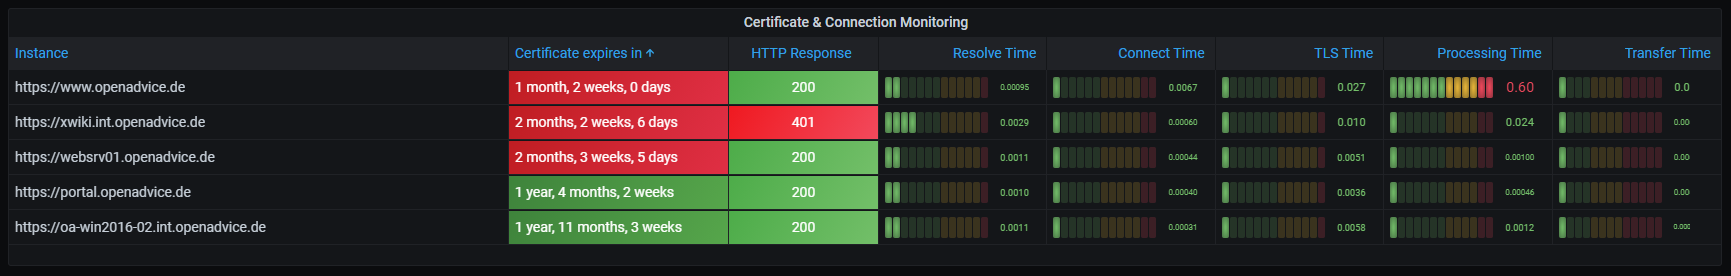
OpenAdvices first published Dahsboard: Just one Table Widget to display the Certificate and Connection Status from HTTPS Connections that are Monitored with Prometheus.
Hi, i'm Malte from OpenAdvice and i referred to this Dashboard in my Grafana Blog post:
Most Applications rely on connections to APIs, databases and maybe some authentication service. If those connection are monitored with the Prometheus Blackbox_exporter you also get the certificate status.
This Dashboard has only one panel to demonstrate how to display all connection metrics utilizing the new Grafana 7 table panel features.
Data source config
Collector type:
Collector plugins:
Collector config:
Revisions
Upload an updated version of an exported dashboard.json file from Grafana
| Revision | Description | Created | |
|---|---|---|---|
| Download |