readsb
Used to visualise metrics collected from the mikenye/readsb-protobuf docker image.
Overview
Used to visualise metrics collected from the mikenye/readsb-protobuf docker image.
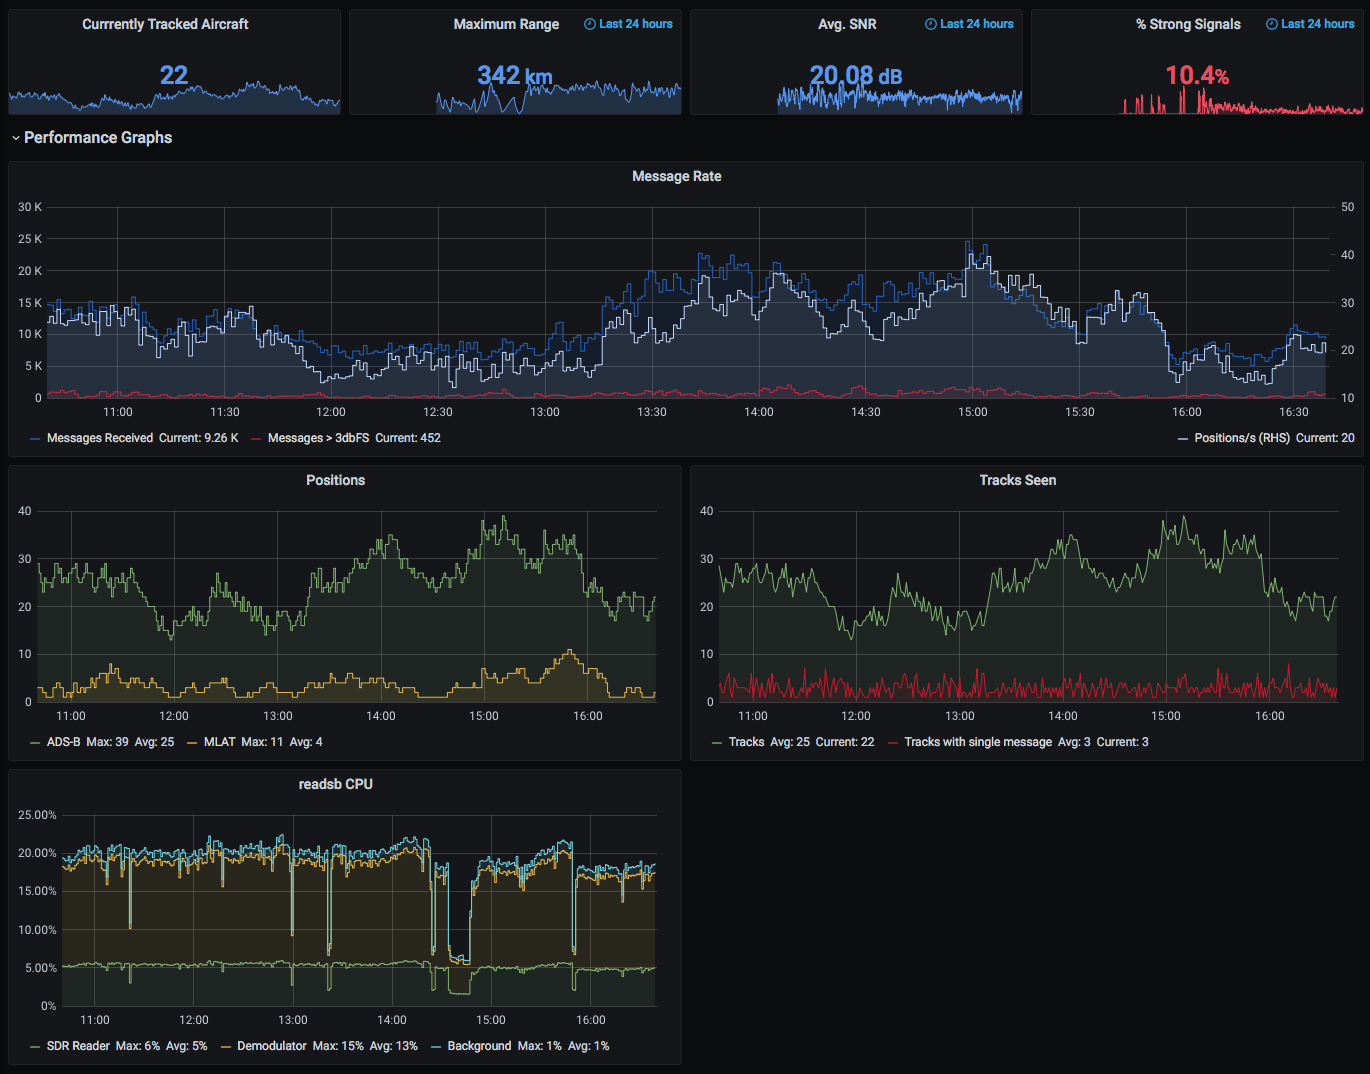
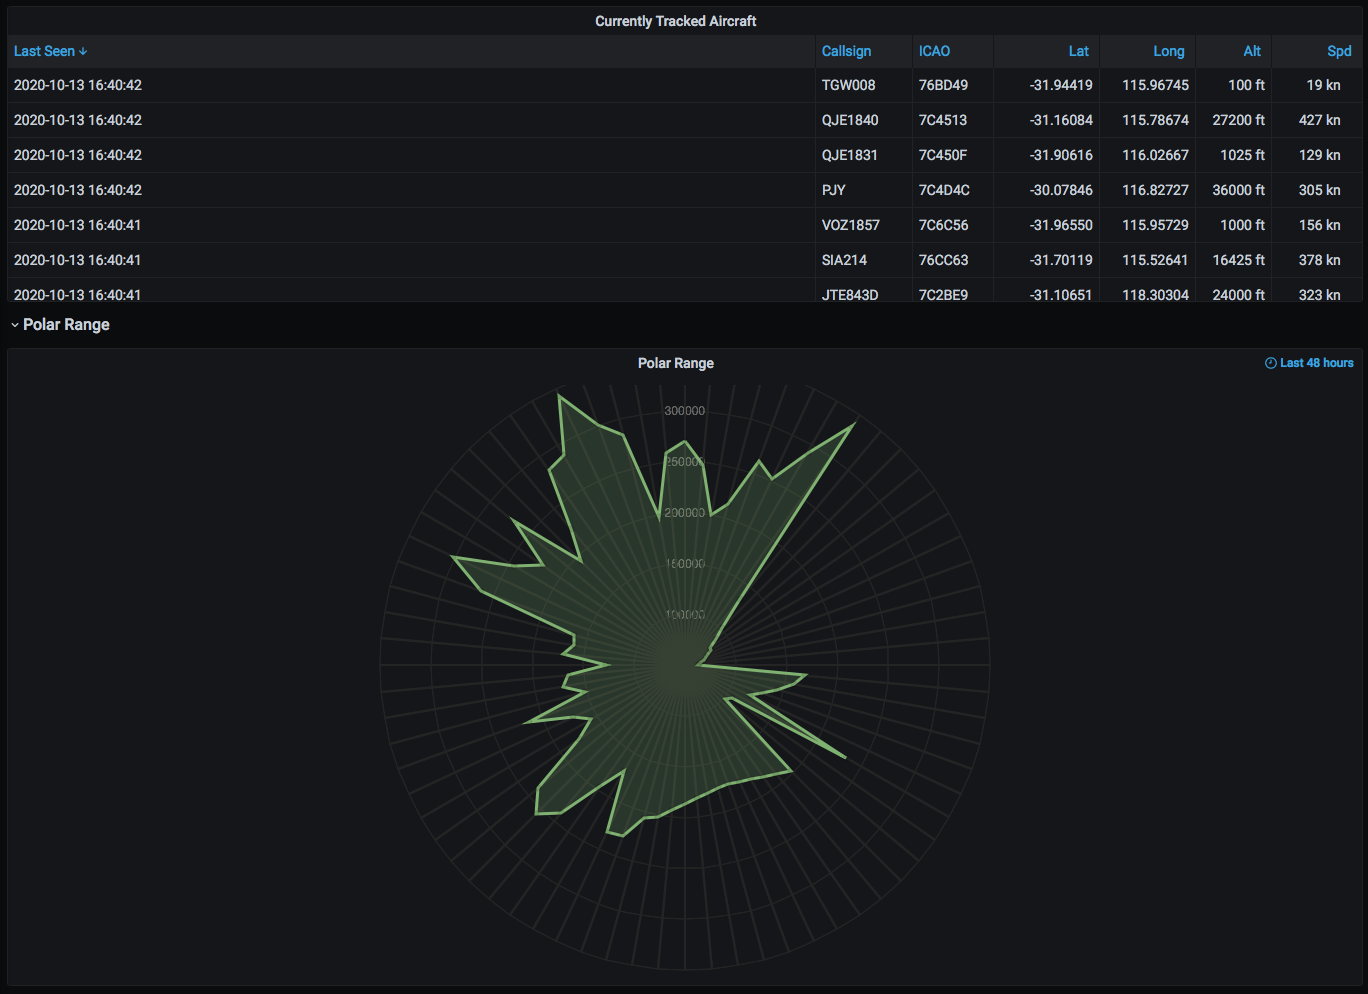
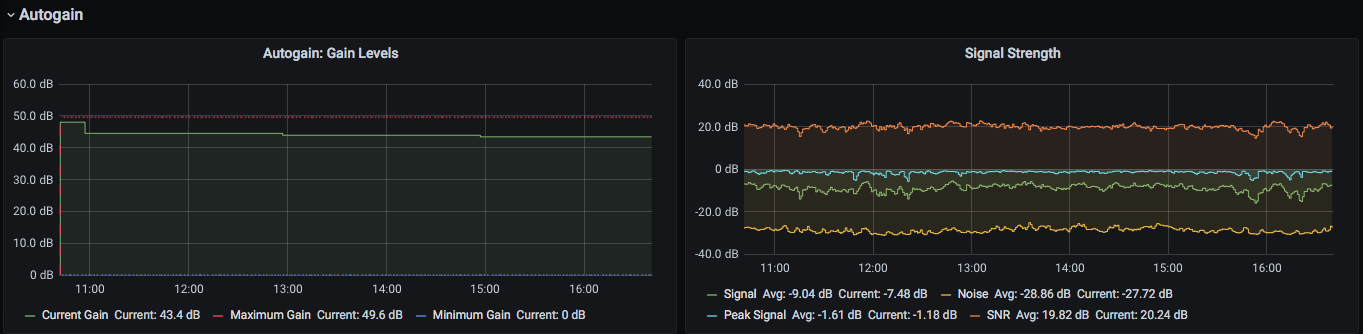
This dashboard aims to emulate the majority of the functionality of graphs1090, but using InfluxDB and Grafana, as well as implement some additional cool features like a polar range plot and information about the autogain system present in the container.
Requirements
snuids-radar-panelinstalled into your Grafana.- An instance of InfluxDB.
- A running instance of the
mikenye/readsb-protobufdocker container.
Data Collection
Data is collected from the mikenye/readsb-protobuf docker image, which contains a built-in instance of Telegraf. In order for the docker container to collect metrics and send them to your InfluxDB instance, set the following environment variables on your container:
| Variable | Description | Default |
|---|---|---|
INFLUXDBURL | The full HTTP URL for your InfluxDB instance. | Unset |
INFLUXDBUSERNAME | If using authentication, a username for your InfluxDB instance. If not using authentication, leave unset. | Unset |
INFLUXDBPASSWORD | If using authentication, a password for your InfluxDB instance. If not using authentication, leave unset. | Unset |
If INFLUXDBURL is left unset, the image's built-in instance of Telegraf will not be started.
Getting help / more info
See the project's README for more information:
Data source config
Collector config:
Upload an updated version of an exported dashboard.json file from Grafana
| Revision | Description | Created | |
|---|---|---|---|
| Download |