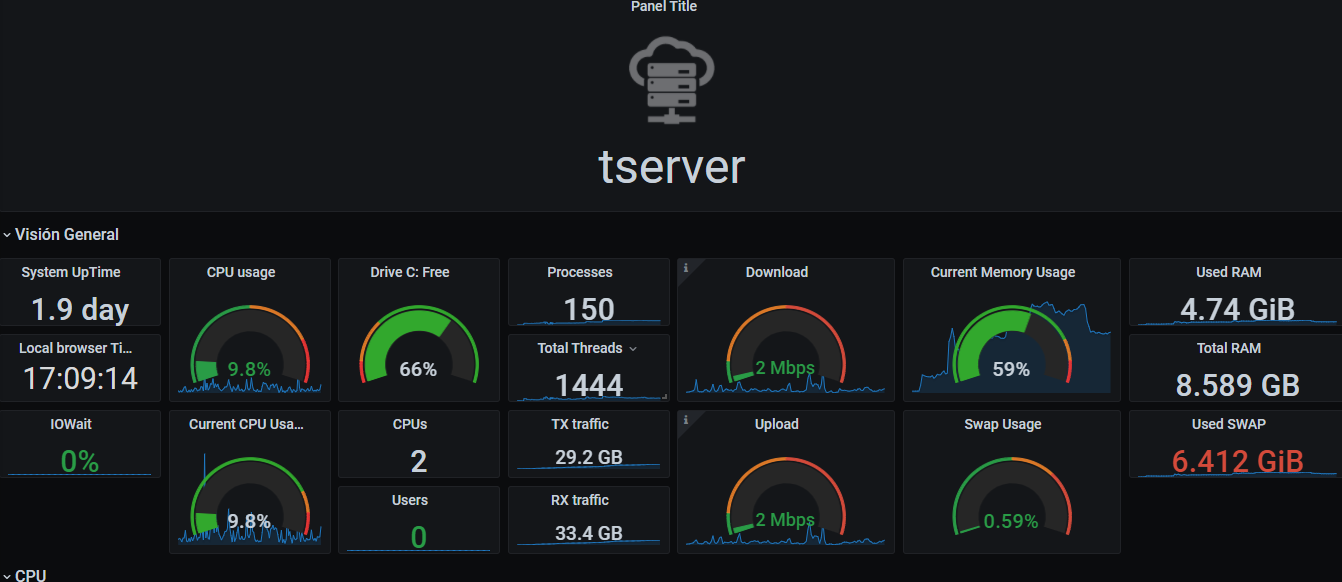
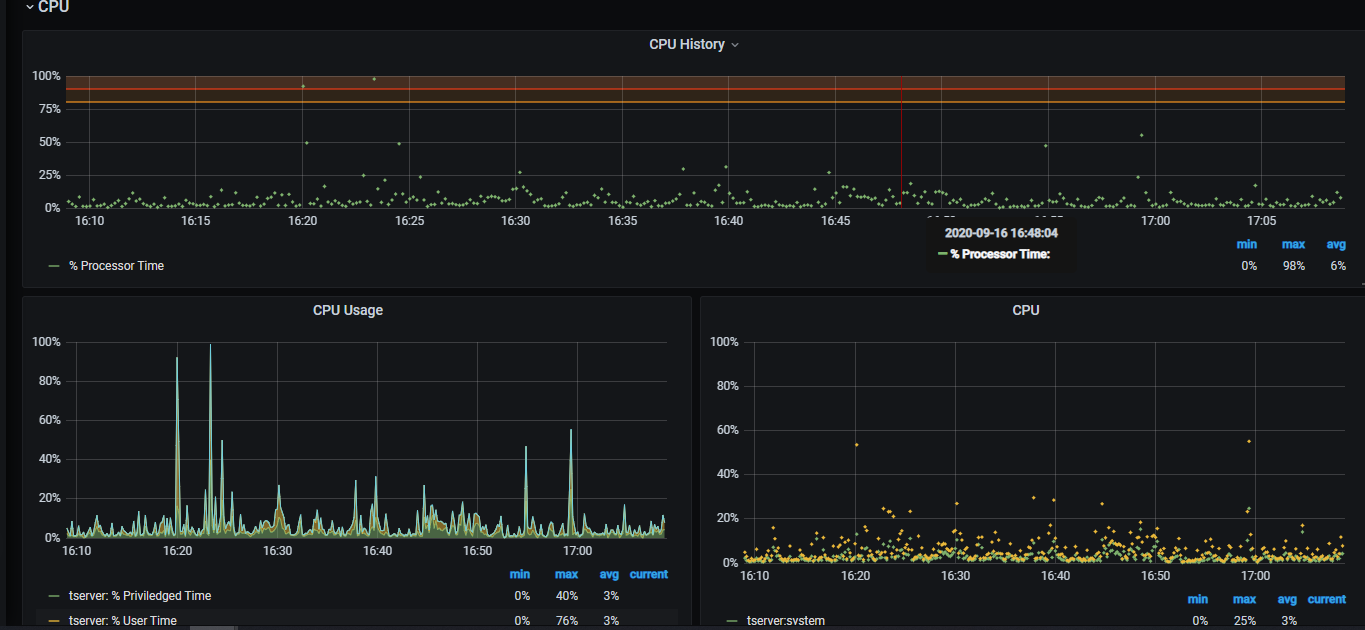
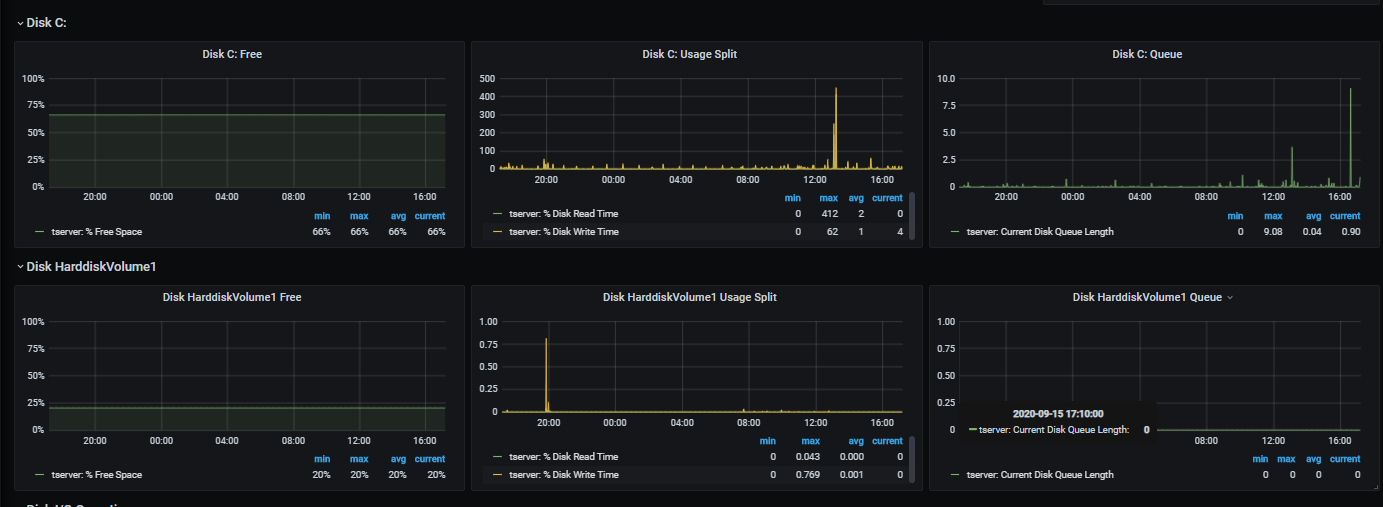
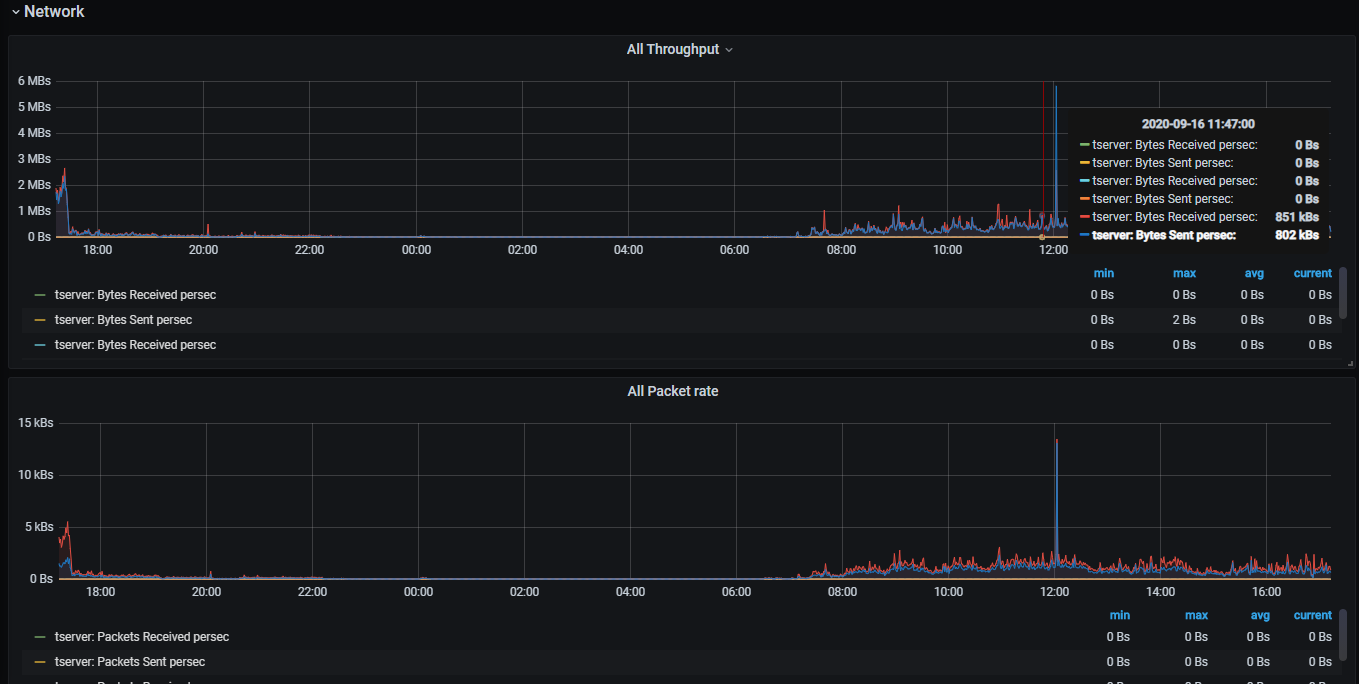
InfluxDB Windows Server Telegraf
All info Server Windows InfluxDB , Telegraf, Windows
Config Telegraf.conf path: C:\Program Files\Telegraf
###############################################################################
INPUT PLUGINS
###############################################################################
Read metrics about cpu usage
[[inputs.cpu]]
Whether to report per-cpu stats or not
percpu = true
Whether to report total system cpu stats or not
totalcpu = true
If true, collect raw CPU time metrics.
collect_cpu_time = false
If true, compute and report the sum of all non-idle CPU states.
  report_active = false
fielddrop = ["time_guest","time_guest_nice","time_irq","time_nice","time_softirq","time_steal","usage_guest","usage_guest_nice","usage_irq","usage_nice","usage_softirq","usage_steal"]
Read metrics about disk usage by mount point
[[inputs.disk]]
Read metrics about disk IO by device
[[inputs.diskio]]
[[inputs.io]]
Get kernel statistics from /proc/stat
[[inputs.kernel]]
Read metrics about memory usage
[[inputs.mem]]
Get the number of processes and group them by status
[[inputs.processes]]
Read metrics about swap memory usage
[[inputs.swap]]
Read metrics about system load & uptime
[[inputs.system]]
Read stats about given file(s)
[[inputs.filestat]]
Read formatted metrics from one or more HTTP endpoints
[[inputs.http]]
Collect statistics about itself
[[inputs.internal]]
This plugin gathers interrupts data from /proc/interrupts and /proc/softirqs.
[[inputs.interrupts]]
Collect virtual and real server stats from Linux IPVS
[[inputs.ipvs]]
Get kernel statistics from /proc/vmstat
[[inputs.kernel_vmstat]]
Provides Linux sysctl fs metrics
[[inputs.linux_sysctl_fs]]
Aggregates the contents of multiple files into a single point
[[inputs.multifile]]
Read metrics about network interface usage
[[inputs.net]]
Collect response time of a TCP or UDP connection
[[inputs.net_response]]
Read TCP metrics such as established, time wait and sockets counts.
[[inputs.netstat]]
Collect kernel snmp counters and network interface statistics
[[inputs.nstat]]
[[inputs.synproxy]]
Monitor process cpu and memory usage
[[inputs.procstat]]
pattern = "httpd|java|python|telegraf|tomcat8|htop|apache2|www-data"
user = "daemon|root|telegraf|www-data|tomcat8"
Sysstat metrics collector
[[inputs.sysstat]]
Gather systemd units state
[[inputs.systemd_units]]
Read metrics of ZFS from arcstats, zfetchstats, vdev_cache_stats, and pools
[[inputs.zfs]]
Data source config
Collector config:
Upload an updated version of an exported dashboard.json file from Grafana
| Revision | Description | Created | |
|---|---|---|---|
| Download |
InfluxDB
Easily monitor InfluxDB, an open source time series database, with Grafana Cloud's out-of-the-box monitoring solution.
Learn more


