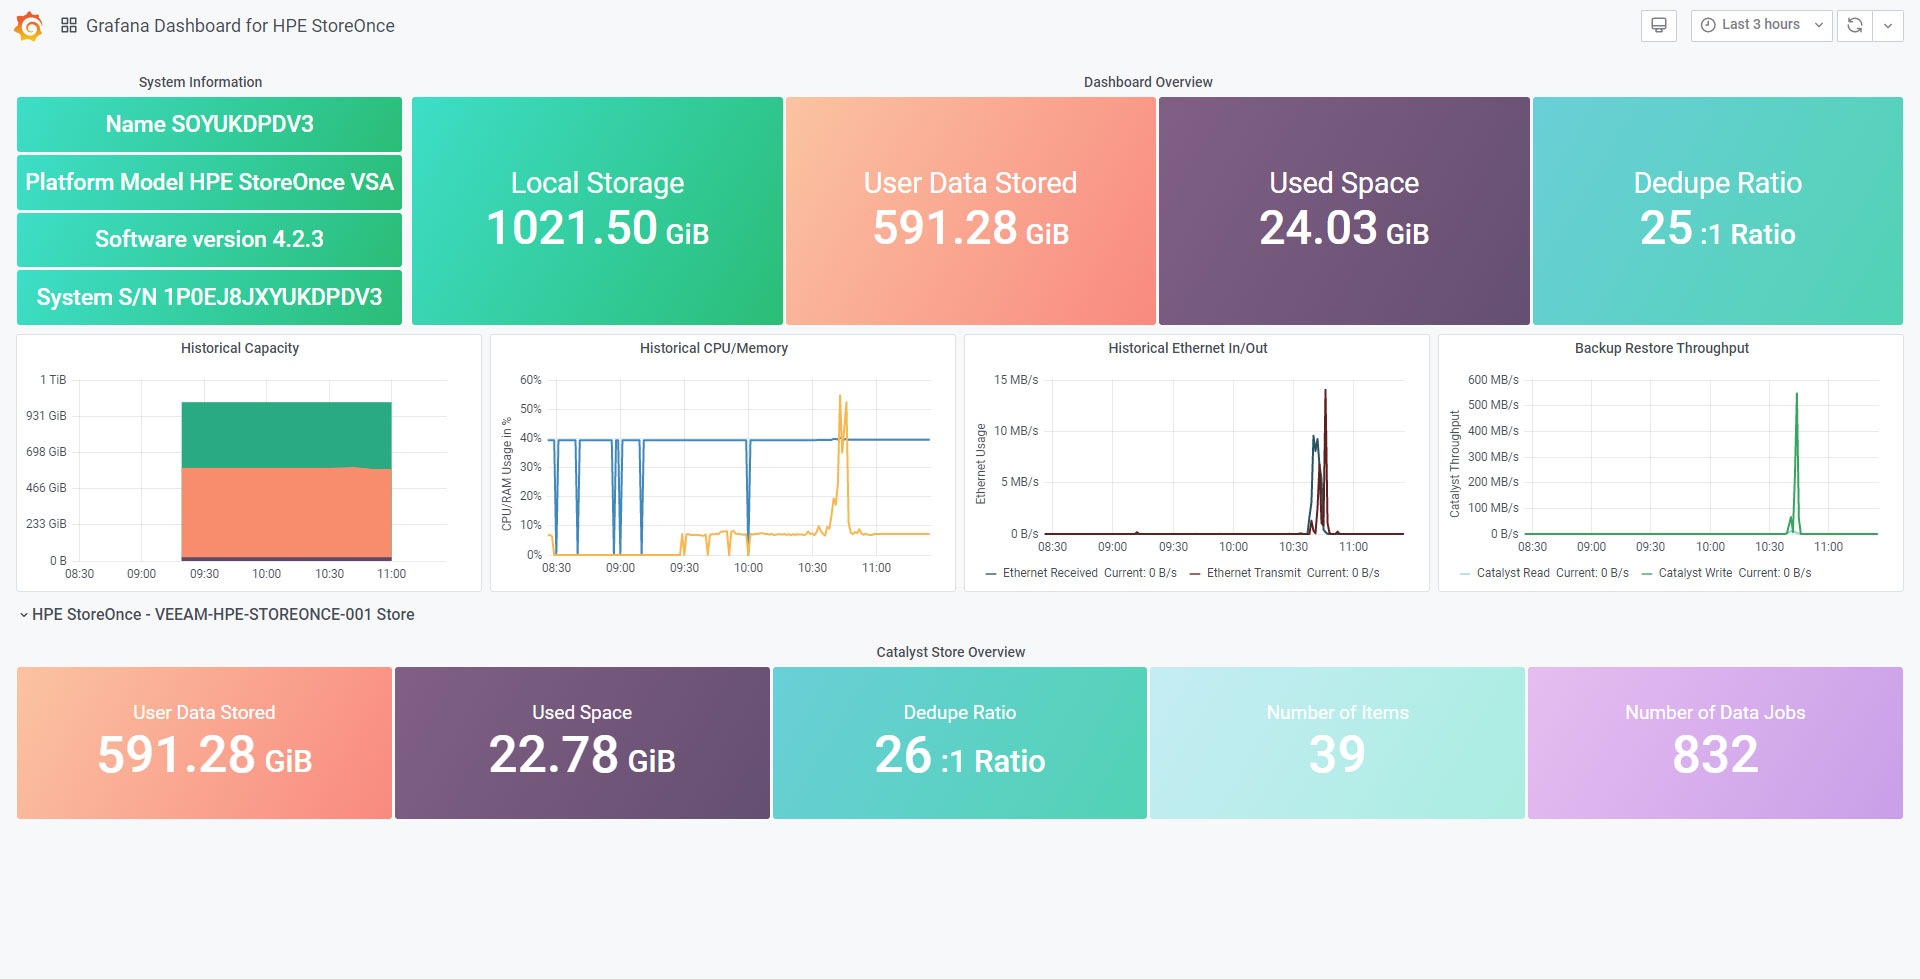
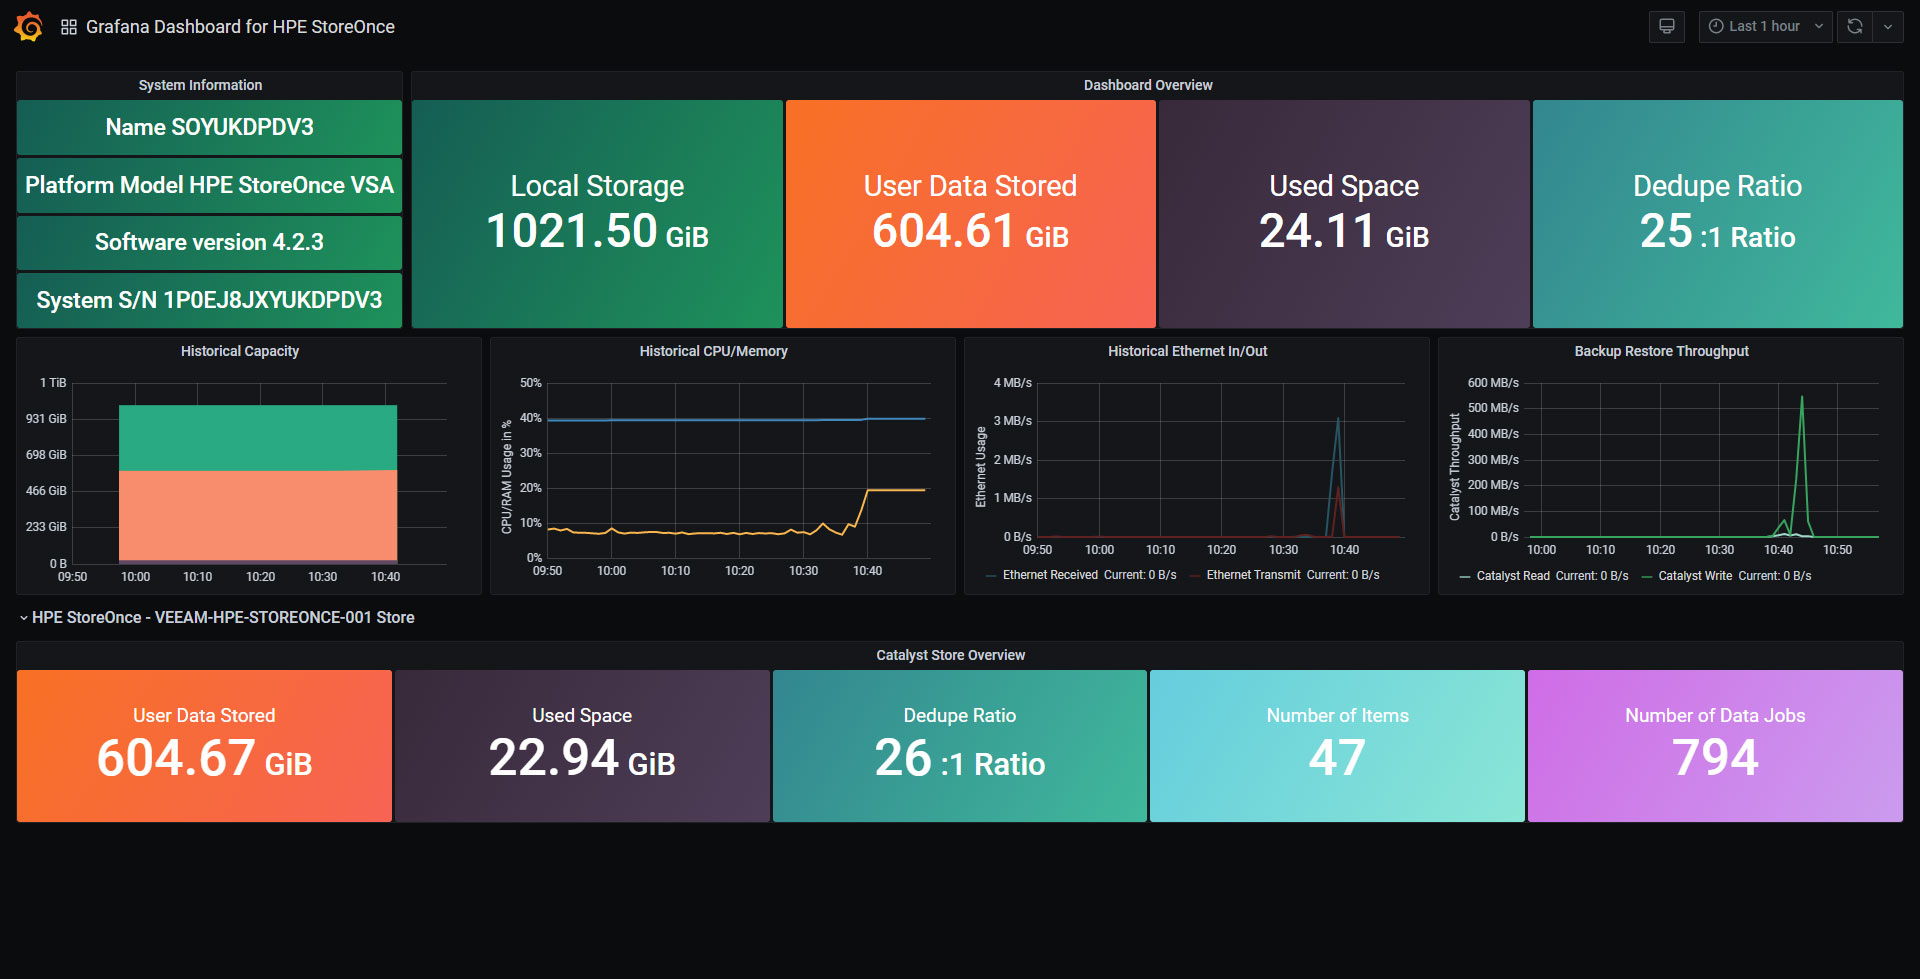
Grafana Dashboard for HPE StoreOnce
Grafana Dashboard for Veeam Backup for HPE StoreOnce RESTful API
Just download the latest HPE StoreOnce script version from GitHub https://raw.githubusercontent.com/jorgedlcruz/hpe-storeonce-grafana/master/hpe_storeonce_grafana.sh and change the Configuration section within your details:
##
# Configurations
##
# Endpoint URL for InfluxDB
InfluxDBURL="http://YOURINFLUXSERVER" #Your InfluxDB Server, http://FQDN or https://FQDN if using SSL
InfluxDBPort="8086" #Default Port
InfluxDB="telegraf" #Default Database
InfluxDBUser="INFLUXUSER" #User for Database
InfluxDBPassword='INFLUXPASS' #Password for Database
Endpoint URL for login action
storeonceUsername="HPEUSERNAME" #Your username, if using domain based account, please add it like user@domain.com (if you use domain\account it is not going to work!)
storeoncePassword='HPEPASS'
storeonceRestServer="https://STOREONCEFQDNORIP"
storeonceRestPort="443" #Default Port
Once the changes are done, make the script executable with chmod:
chmod +x hpe_storeonce_grafana.sh
The output of the command should be something like the next, without errors:
Writing hpe_storeonce_catalyst to InfluxDB
HTTP/1.1 204 No Content
Content-Type: application/json
Request-Id: ee61e4fc-f0ef-11ea-ae93-dca632b112f7
X-Influxdb-Build: OSS
X-Influxdb-Version: 1.8.2
X-Request-Id: ee61e4fc-f0ef-11ea-ae93-dca632b112f7
Date: Mon, 07 Sep 2020 09:53:07 GMT
If so, please now add this script to your crontab, like for example every 30 minutes:
*/30 * * * * * /home/oper/hpe_storeonce_grafana.sh >> /var/log/hpe_storeonce_grafana.log 2>&1
Then download or import this Dashboard to your Grafana, and you should see something similar to the next:

Data source config
Collector config:
Upload an updated version of an exported dashboard.json file from Grafana
| Revision | Description | Created | |
|---|---|---|---|
| Download |