vSphere - Datastore utilization
Dashboard for Datastore metrics in a VMware vSphere environments
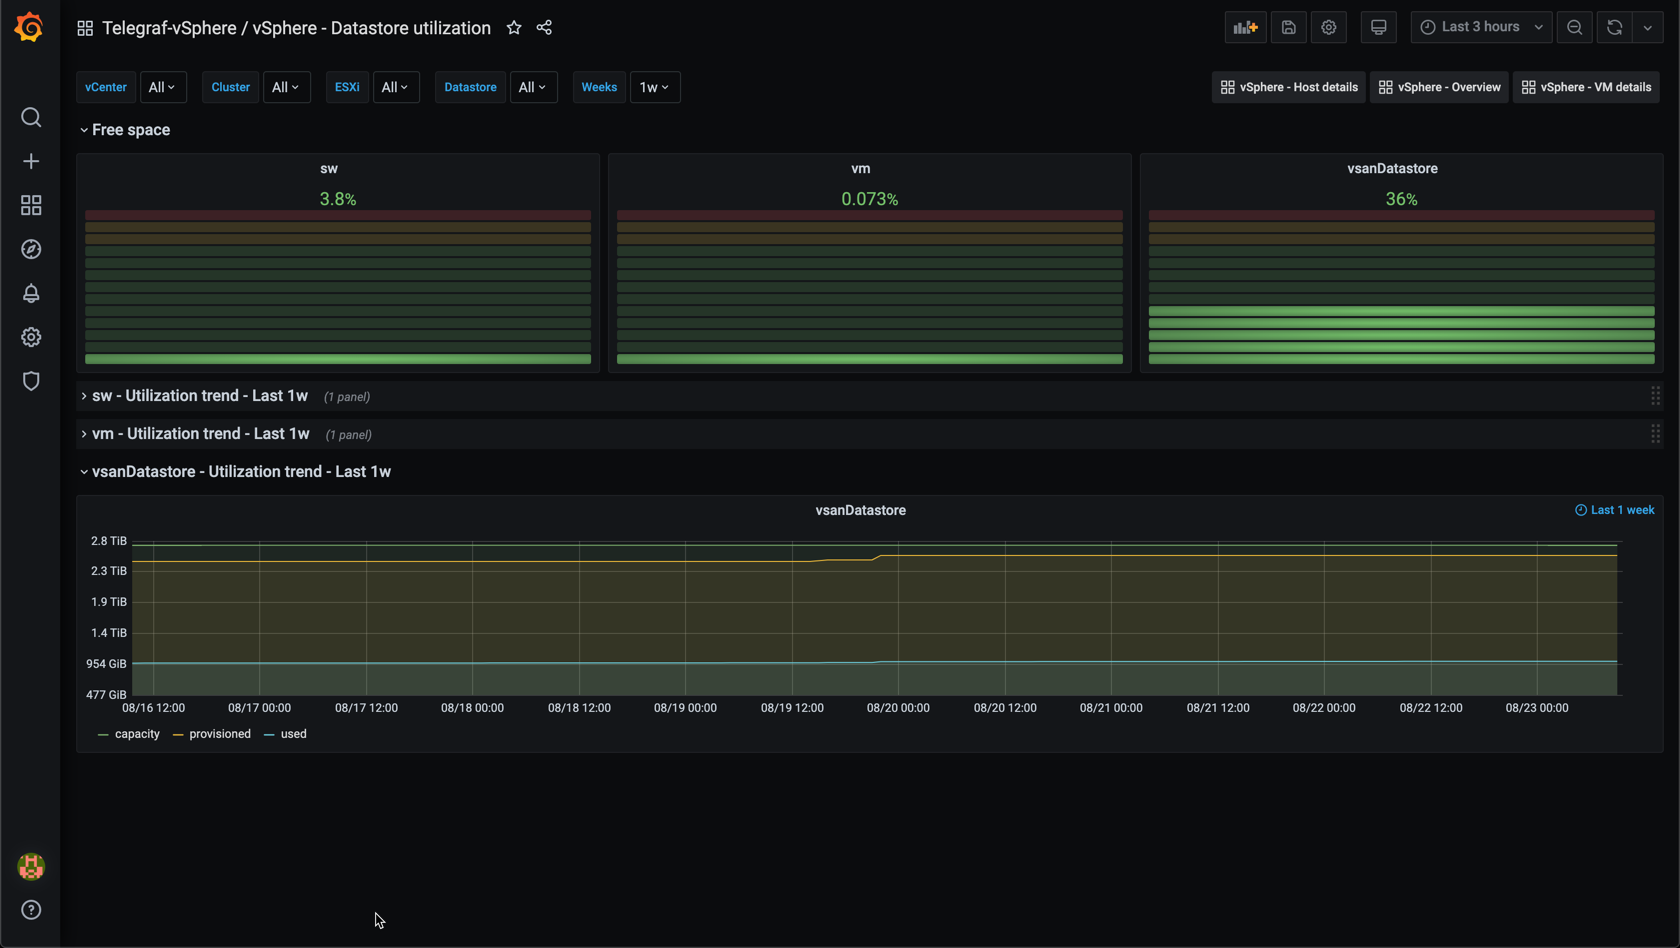
This dashboard gives an overview of the utilization on VMware vSphere datastores. Data is pulled from vCenter with the vSphere plugin of the Telegraf agent. The data is stored in an InfluxDB timeseries database.
The dashboard shows the current free space in percentage for all datastores, and a trend of the utilization for a configurable time range.
Note that the variable query for InfluxDB can return stale tags if retention is not set up on your database. See this post for more information
See also my other dashboards:
Data source config
Collector config:
Upload an updated version of an exported dashboard.json file from Grafana
| Revision | Description | Created | |
|---|---|---|---|
| Download |
VMware vSphere
Easily monitor VMware vSphere, a virtualization platform that helps consolidate IT infrastructure, with Grafana Cloud's out-of-the-box monitoring solution.
Learn more