Grafana Dashboard for Veeam Backup for Nutanix AHV
Grafana Dashboard for Veeam Backup for Nutanix AHV RESTful API. Grafana 7.x
Just download the latest Veeam Backup for Nutanix AHV script version from GitHub https://raw.githubusercontent.com/jorgedlcruz/veeam-backup-for-nutanix-grafana/master/veeam_nutanixahv.sh and change the Configuration section within your details:
# Endpoint URL for InfluxDB
veeamInfluxDBURL="http://YOURINFLUXSERVERIP" #Your InfluxDB Server, http://FQDN or https://FQDN if using SSL
veeamInfluxDBPort="8086" #Default Port
veeamInfluxDB="telegraf" #Default Database
veeamInfluxDBUser="USER" #User for Database
veeamInfluxDBPassword='PASSWORD' #Password for Database
Endpoint URL for login action
veeamUsername="YOURUSER"
veeamPassword="YOURPASS"
veeamRestServer="https://YOURVEEAMAHVPROXY"
Once the changes are done, make the script executable with chmod:
chmod +x veeam_nutanixahv.sh
The output of the command should be something like the next, without errors:
Writing veeam_nutanix_repository to InfluxDB
HTTP/1.1 204 No Content
Content-Type: application/json
Request-Id: d8c5a770-e134-11ea-a250-dca632b112f7
X-Influxdb-Build: OSS
X-Influxdb-Version: 1.8.2
X-Request-Id: d8c5a770-e134-11ea-a250-dca632b112f7
Date: Tue, 18 Aug 2020 09:26:07 GMT<br>
If so, please now add this script to your crontab, like for example every 30 minutes:
*/30 * * * * /home/oper/veeam_nutanixahv.sh >> /var/log/veeam_nutanixahv.log 2>&1
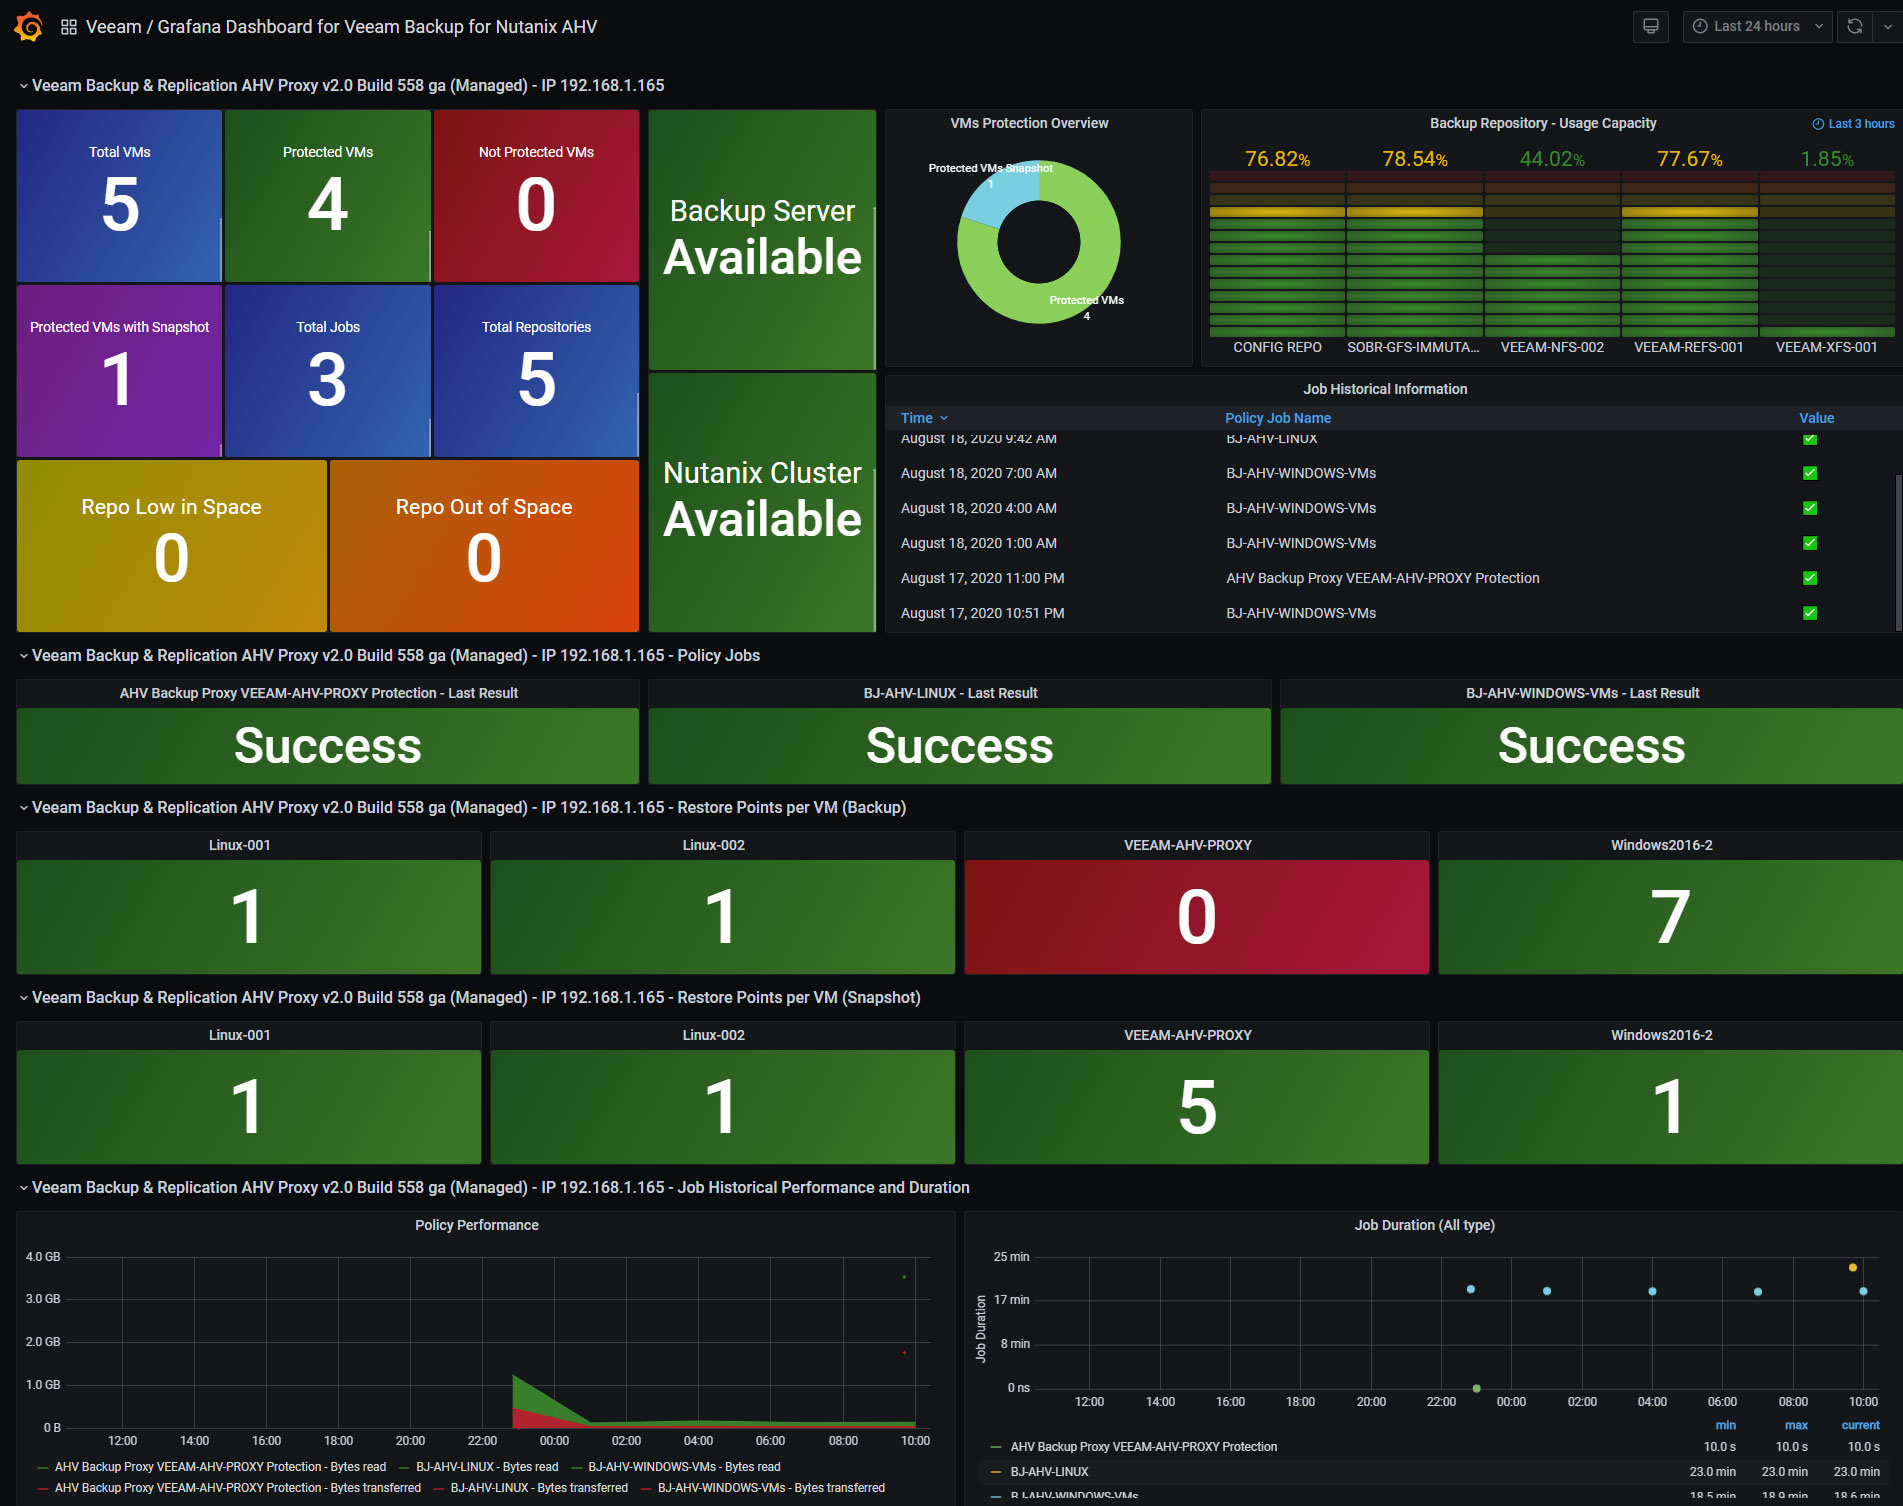
Then download or import this Dashboard to your Grafana, and you should see something similar to the next:

Data source config
Collector config:
Upload an updated version of an exported dashboard.json file from Grafana
| Revision | Description | Created | |
|---|---|---|---|
| Download |