Redis
Predefined dashboards to observe any Redis database using Redis Data Source. Requires Grafana 7.1+.
Redis Datasource Dashboards
This dashboard lets you observe any Redis database using the Redis Data Source for Grafana.
The Redis Data Source for Grafana is a plug-in that lets you connect to any Redis database, on-premises or in the cloud. You get out-of-the-box predefined dashboards, and you can build customized dashboards to monitor Redis and application data.
Deployments
These dashboards work with any Redis database on any platform.
If you’re looking for Prometheus-based metrics for Redis Enterprise or Redis Cloud, see the following dashboards:
Available metrics
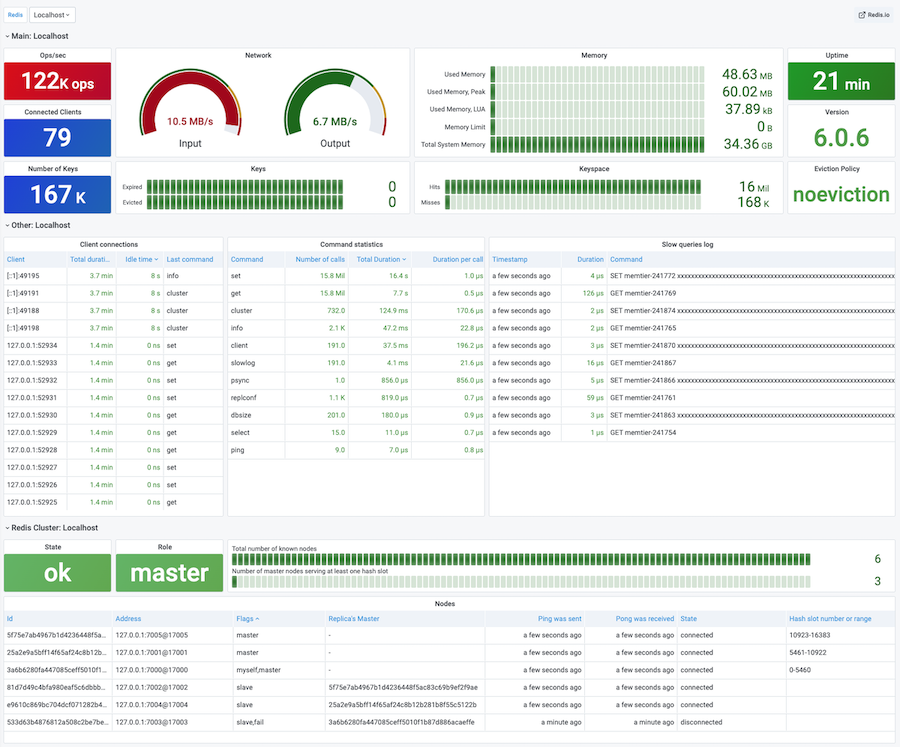
This dashboard exposes the following metrics:
- Operations per second
- Connected clients
- Number of Keys, Expired and Evicted Keys
- Network (Inbound, Outbound)
- Memory (Used Memory, Used Memory Peak and LUA, Memory Limit and Total System memory)
- Uptime and Version
- Eviction Policy
- Client connections
- Command statistics
- Slow queries log
- Redis cluster
Requirements
Requires Grafana 7.1+ with a new backend plug-in platform to the support the Redis Data Source for Grafana.
Documentation
Please take a look at the documentation to learn more about this plug-in and its features.
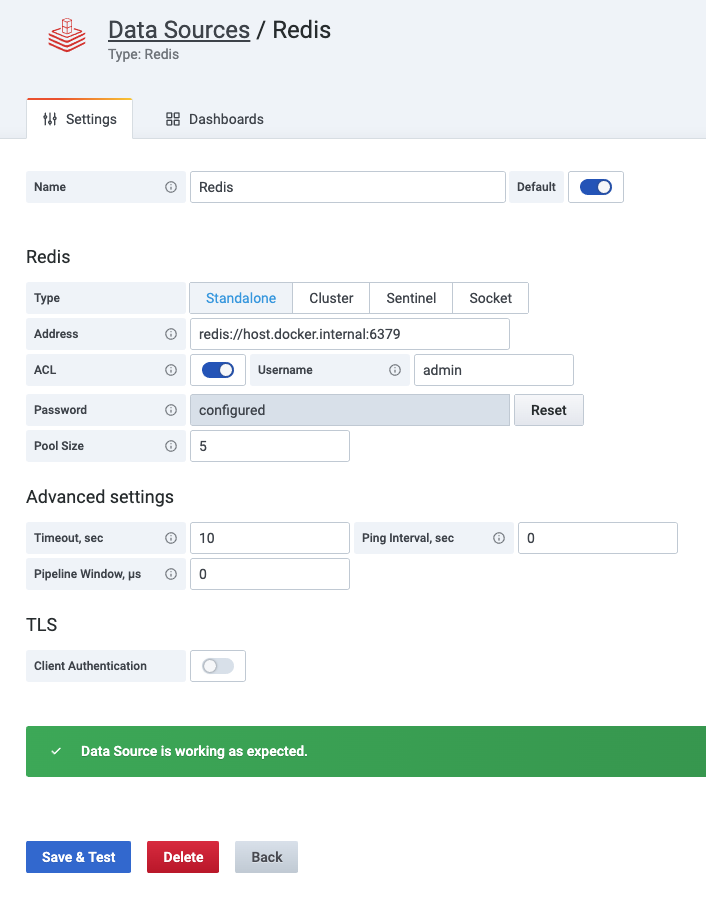
Data source config
Collector config:
Upload an updated version of an exported dashboard.json file from Grafana
| Revision | Description | Created | |
|---|---|---|---|
| Download |
Redis
Monitor Redis with Grafana. Easily monitor your Redis deployment with Grafana Cloud's out-of-the-box monitoring solution.
Learn more