VictoriaMetrics - vmagent
Overview for VictoriaMetrics vmagent v1.117.0 or higher
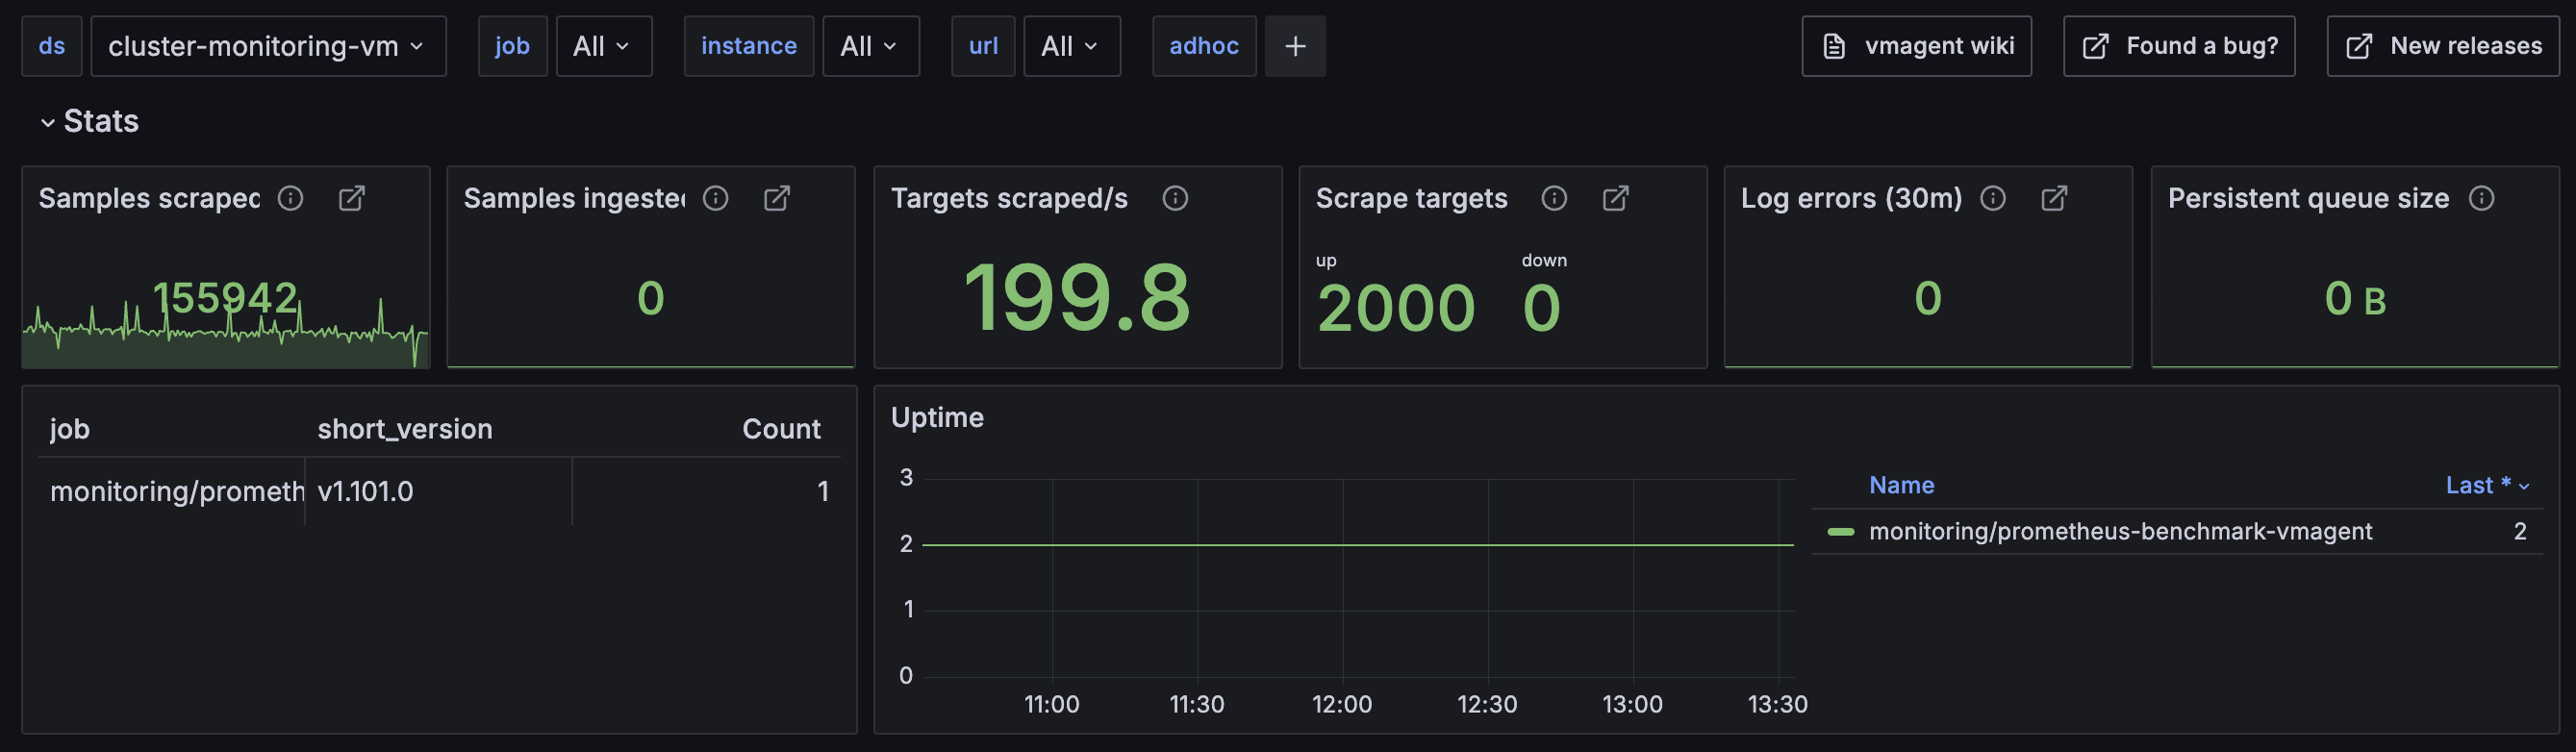
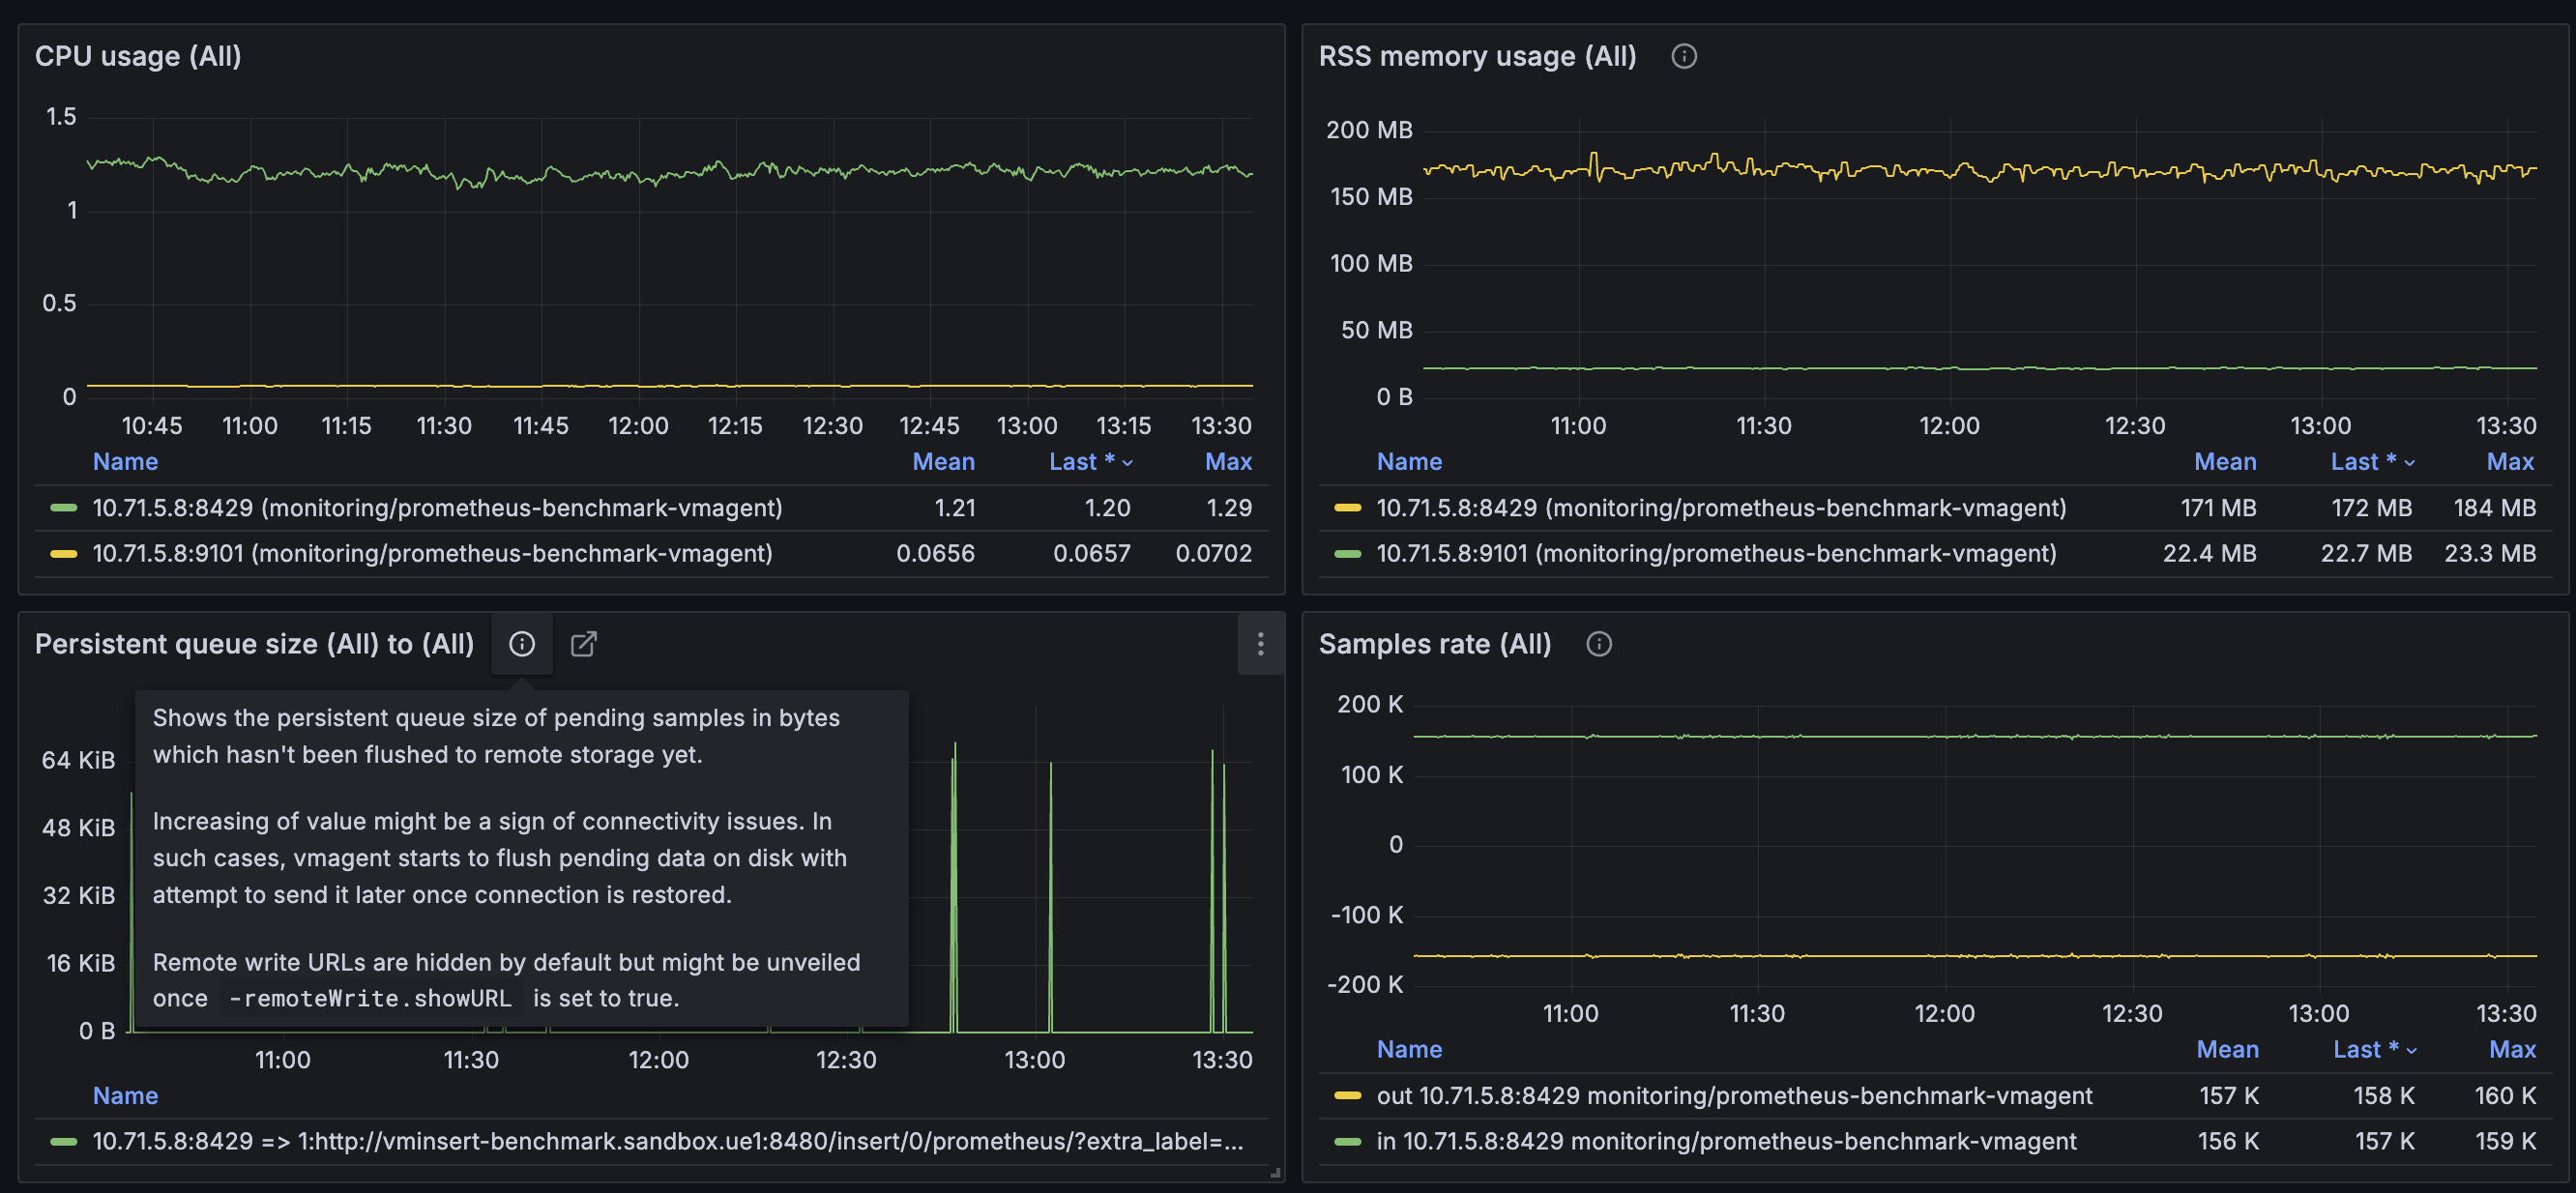
VictoriaMetrics vmagent overview
Requirements
vmagent: each revision may have different vmagent version requirements.
Grafana: each revision may have different Grafana version requirements.
Configure vmagent to scrape its own metrics in --promscrape.config file. Alternatively, scrape vmagent metrics via Prometheus, single VictoriaMetrics or separate vmagent service. vmagent exports various metrics in Prometheus exposition format at http://vmagent-host:8429/metrics page. See also additional info about monitoring for vmagent.
In Grafana configure Prometheus datasource with VictoriaMetrics URL. Dashboard uses metricsql expressions so it is highly recommended to use only VictoriaMetrics storage as source.
Description
Dashboard contains visualization of most useful metrics displaying current state and performance of the service. Most of the panels on dashboard contain additional information or explanation for graphs. If you have suggestions, improvements or found a bug - feel free to add issue or add review to the dashboard.
More information about VictoriaMetrics and vmagent.
Data source config
Collector config:
Upload an updated version of an exported dashboard.json file from Grafana
| Revision | Description | Created | |
|---|---|---|---|
| Download |