PFsense Firewall and IDS
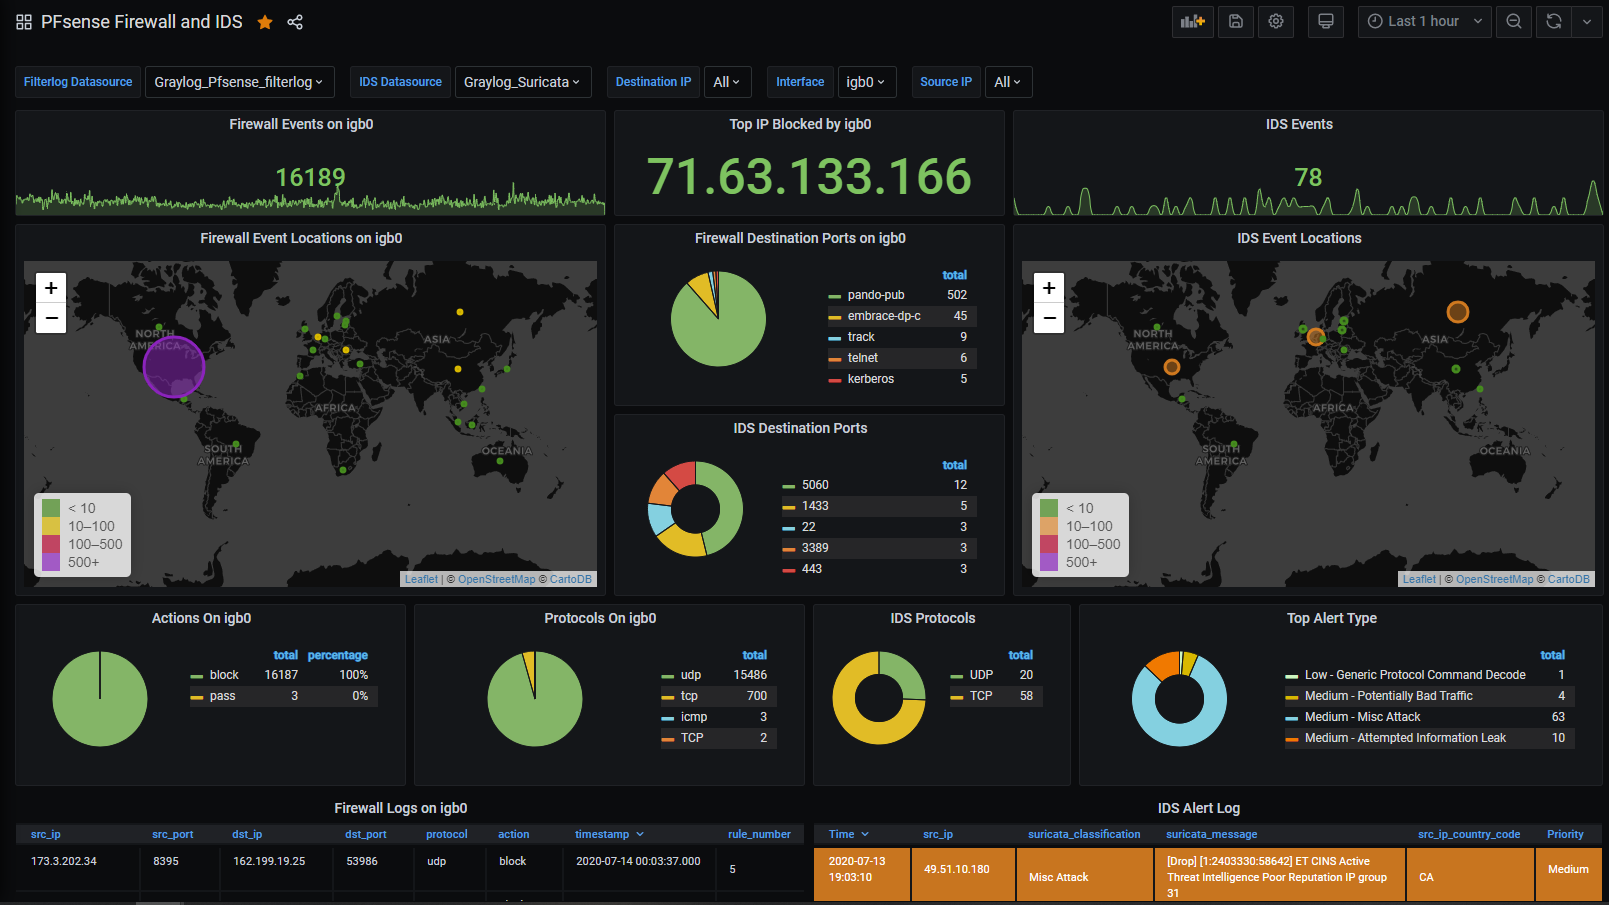
A pfSense dashboard that displays IDS (suricata) and Firewall events. Uses Graylog as the backend.
This dashboard shows Firewall and IDS Events along with logs pulled from Graylog. Designed to work with pfsense. To setup pfsense and graylog, use this excellent write-up by Jake -
https://jake.stride.me.uk/posts/2020/06/28/pfsense-suricata-and-snort-syslog-to-graylog.html
https://jake.stride.me.uk/posts/2020/07/04/pfsense-graylog-parsing.html
Additional note - these setup instructions have a few problems. Barnyard2 is deprecated. Using suricata, enable sending alerts to syslog. This completely bypasses the need for Barnyard2. I also recommend running your IDS on your LAN interface(s), and not your WAN interface(s). This will give you better alerts (internal server being hit rather than the external IP) and reduce the alerts, because most packets are blocked by the firewall anyways. No reason to scan packets that will be dropped by the firewall!
Please note: You may need to tweak your elasticsearch install a bit - this dashboard allows you to drill down in firewall logs, which can have obscene numbers of different source and destination IP addresses. Edit the elasticsearch.yml file (/etc/elasticsearch/elasticsearch.yml) and place this at the bottom:
indices.query.bool.max_clause_count: 10240
This will help in the event you want to select bunches of different IPs in the dropdowns, or if you have tons of WAN ip addresses. Please note that the dropdowns have a maximum number they can display (1000) so all IPs in your log may not show up in the dropdown. This is a grafana limitation.
If you have difficulties, hit me up on reddit: u/althornin
Data source config
Collector config:
Upload an updated version of an exported dashboard.json file from Grafana
| Revision | Description | Created | |
|---|---|---|---|
| Download |

