MinIO Object Storage
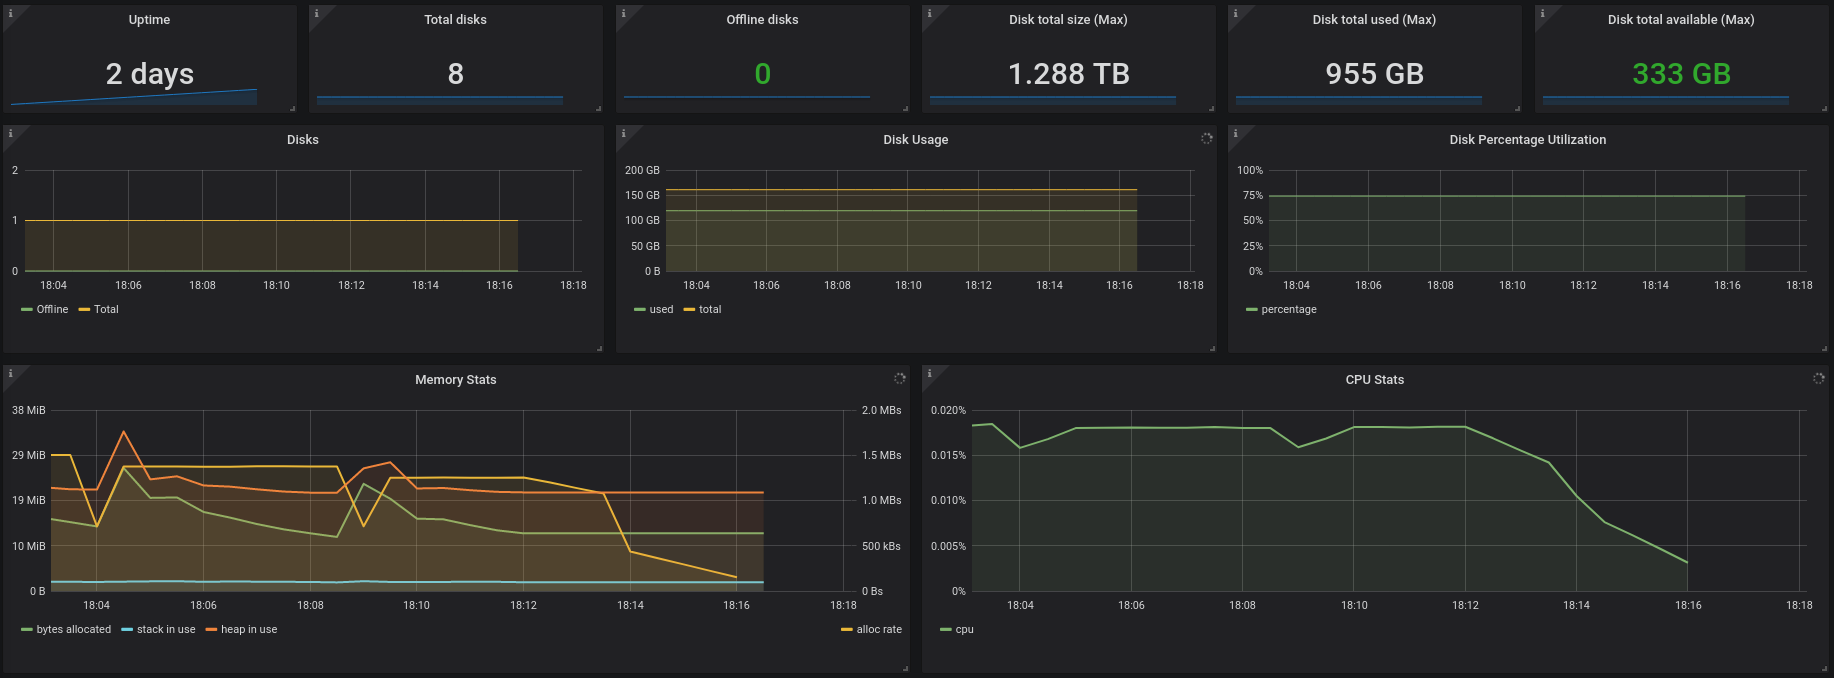
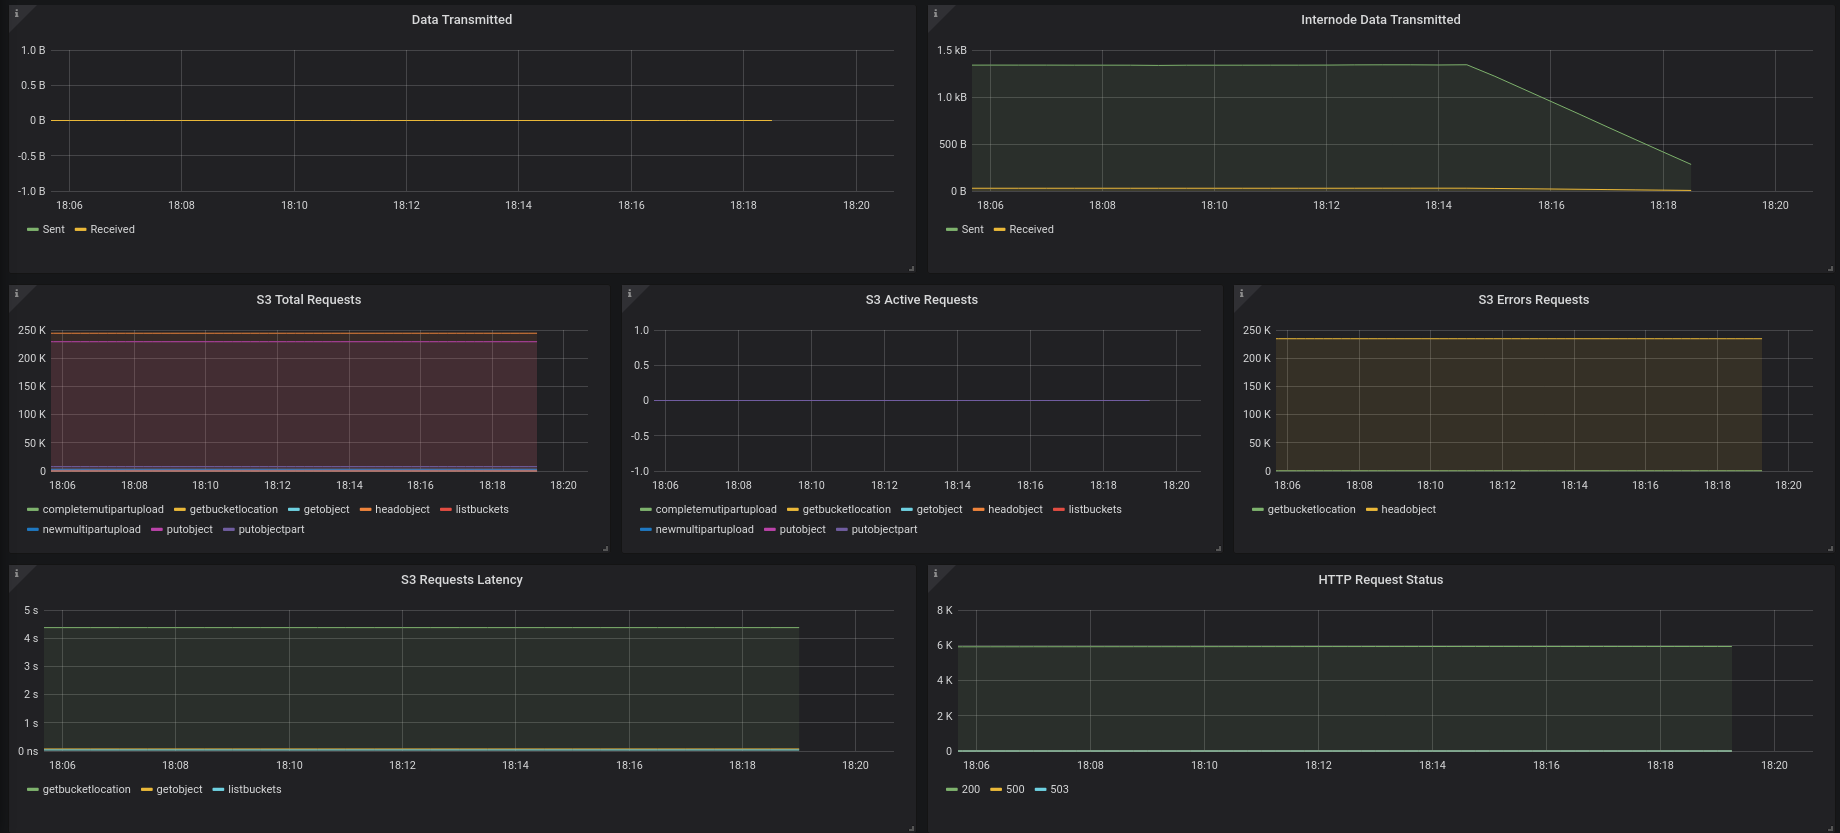
MinIO dashboard - https://min.io/
MinIO server exposes metrics on /minio/prometheus/metrics endpoint. Use the the demo server at https://play.min.io:9000/minio/prometheus/metrics to see the full list of exposed metrics.
Example of configuration:
- job_name: minio
    metrics_path: /minio/prometheus/metrics
    scheme: http
    static_configs:
      - targets: ['127.0.0.1:9000']
More instructions to configure the collector, can be found here: How to monitor MinIO server with Prometheus
Data source config
Collector config:
Upload an updated version of an exported dashboard.json file from Grafana
| Revision | Description | Created | |
|---|---|---|---|
| Download |
MinIO
Easily monitor Minio, a Kubernetes-native high-performance object storage server, with Grafana Cloud's out-of-the-box monitoring solution.
Learn more

