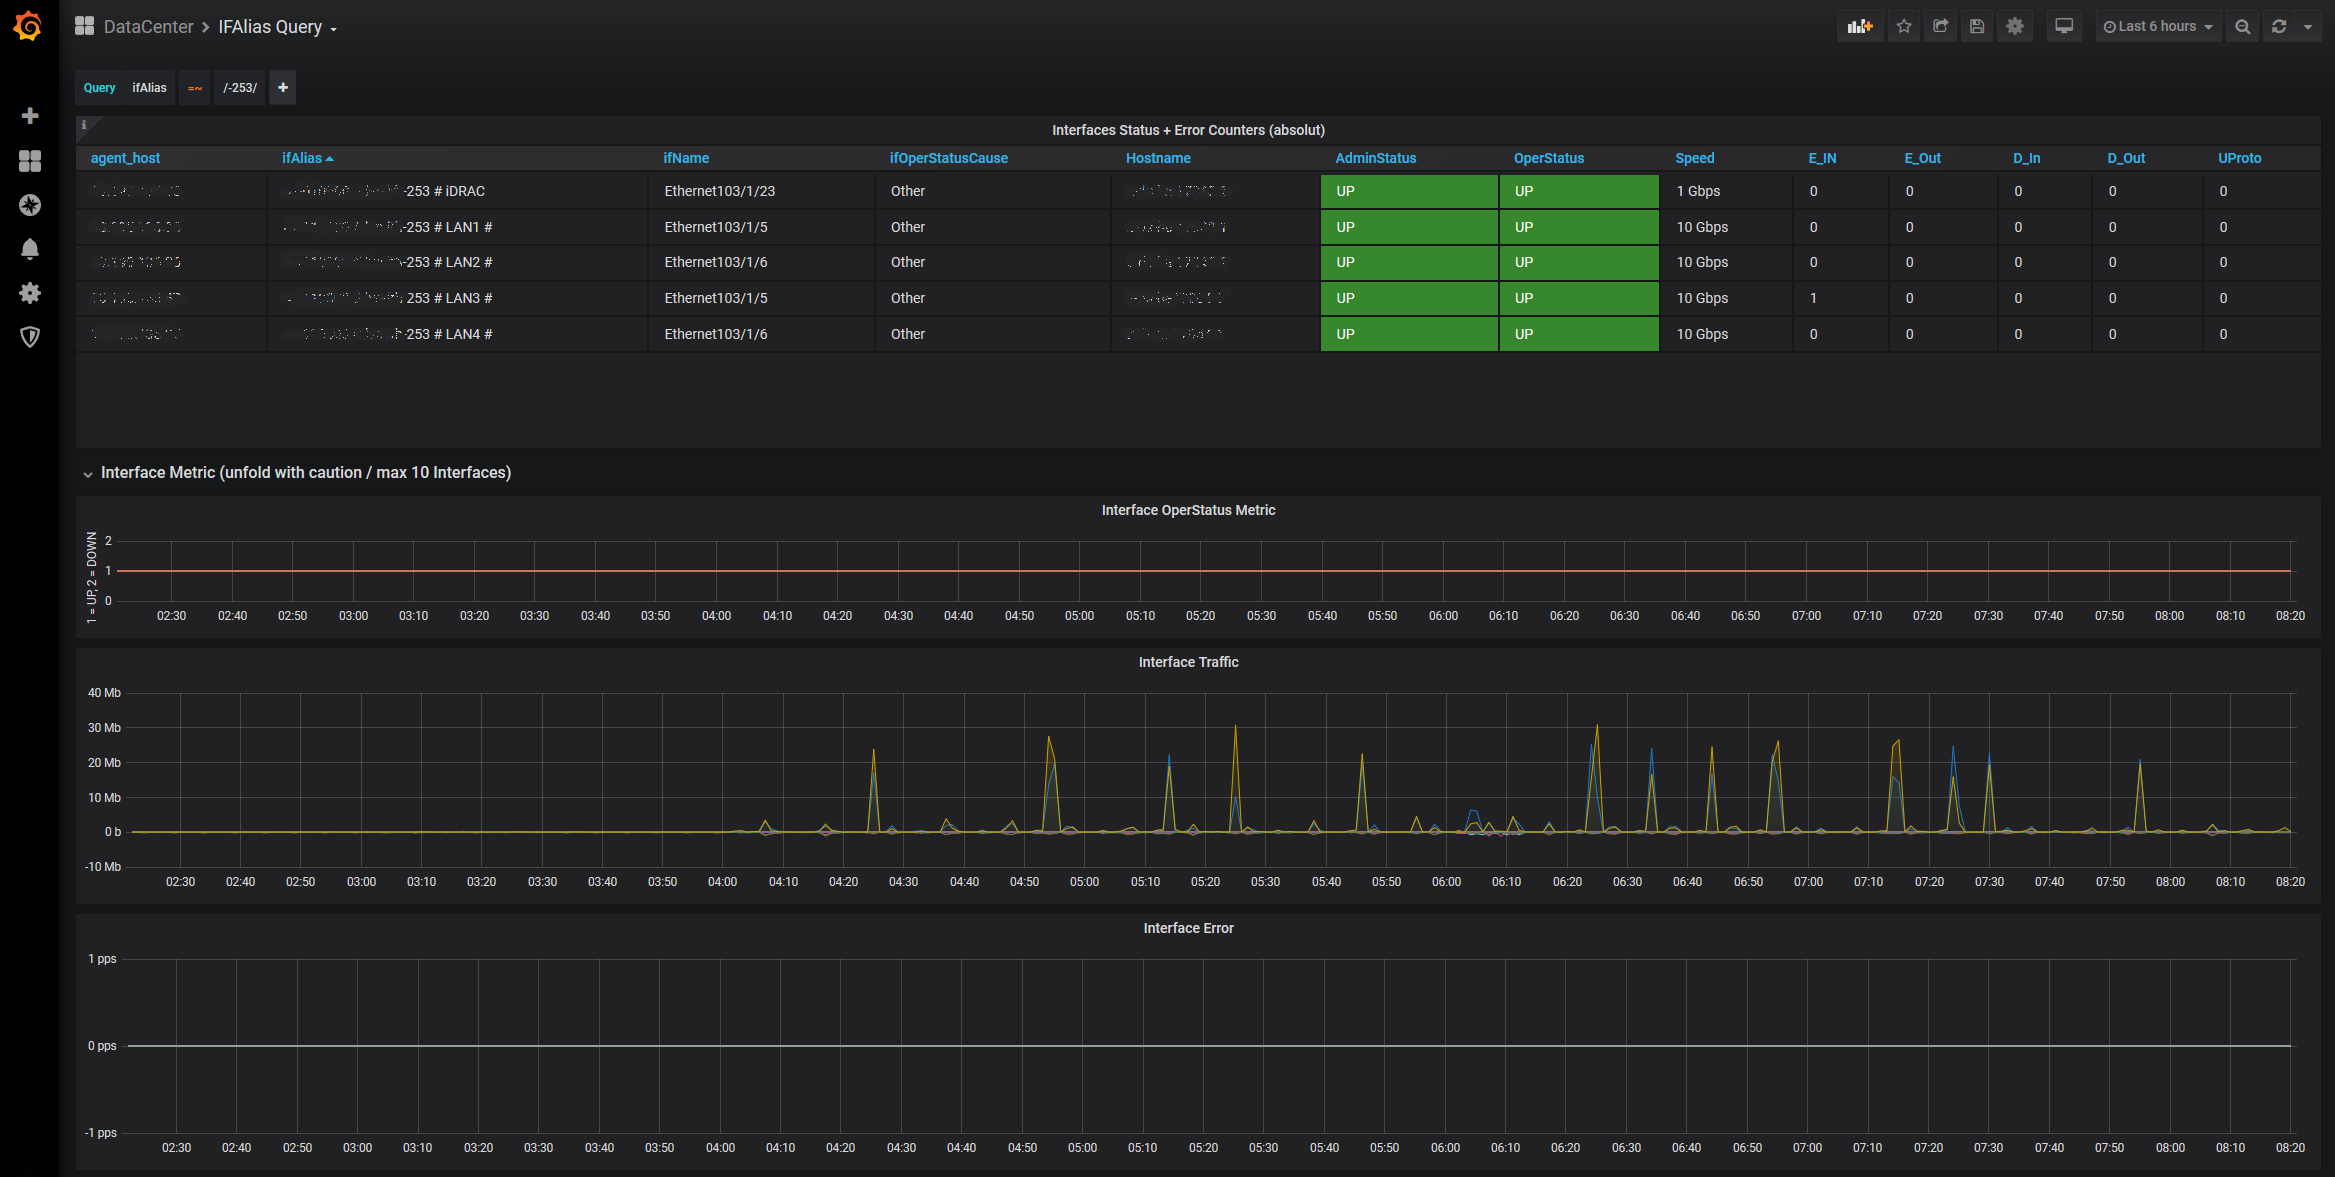
Cisco NXOS/ACI IfAlias
No.1 Troubleshooting Dashboard - Filter Interface Statistics based on IfAlias/Description
Cisco NX-OS and ACI - IfAlias Dashboard
So this one has the potential to become your most popular dashboard ... ever.
Data gathering
Telegraf polls configured devices (agents) via SNMPv3 and stores all metrics as a measurement IF in the InfluxDB. You might like to adjust the [inputs.snmp.tagpass] section if you want to poll portchannel or loopback Interfaces as well.
Dashboard usage
When you open the dashboard nothing is displayed, because the ad hoc query at the top of the screen is set to an unused default value. Just enter a (part of a) searchstring of your connected device, be it a server, Firewall, WAN Edge,... and the Dashboards provides full interfaces statistics of all Switches with this IfAlias, as well as three graph panels with Interface status, Traffic and Errors over time. Remember: The query uses regex, so it has to begin and end with an slash, like /-253/ in the example to find the Server with -253 in the name.
Share this dashboard with your serverteam, service desk, basically everyone connecting straight to your network and your ticket count will drop significantly. Because now everybody can self evaluate the network side of their devices.
Data source config
Collector config:
Upload an updated version of an exported dashboard.json file from Grafana
| Revision | Description | Created | |
|---|---|---|---|
| Download |

