
Choria Broker
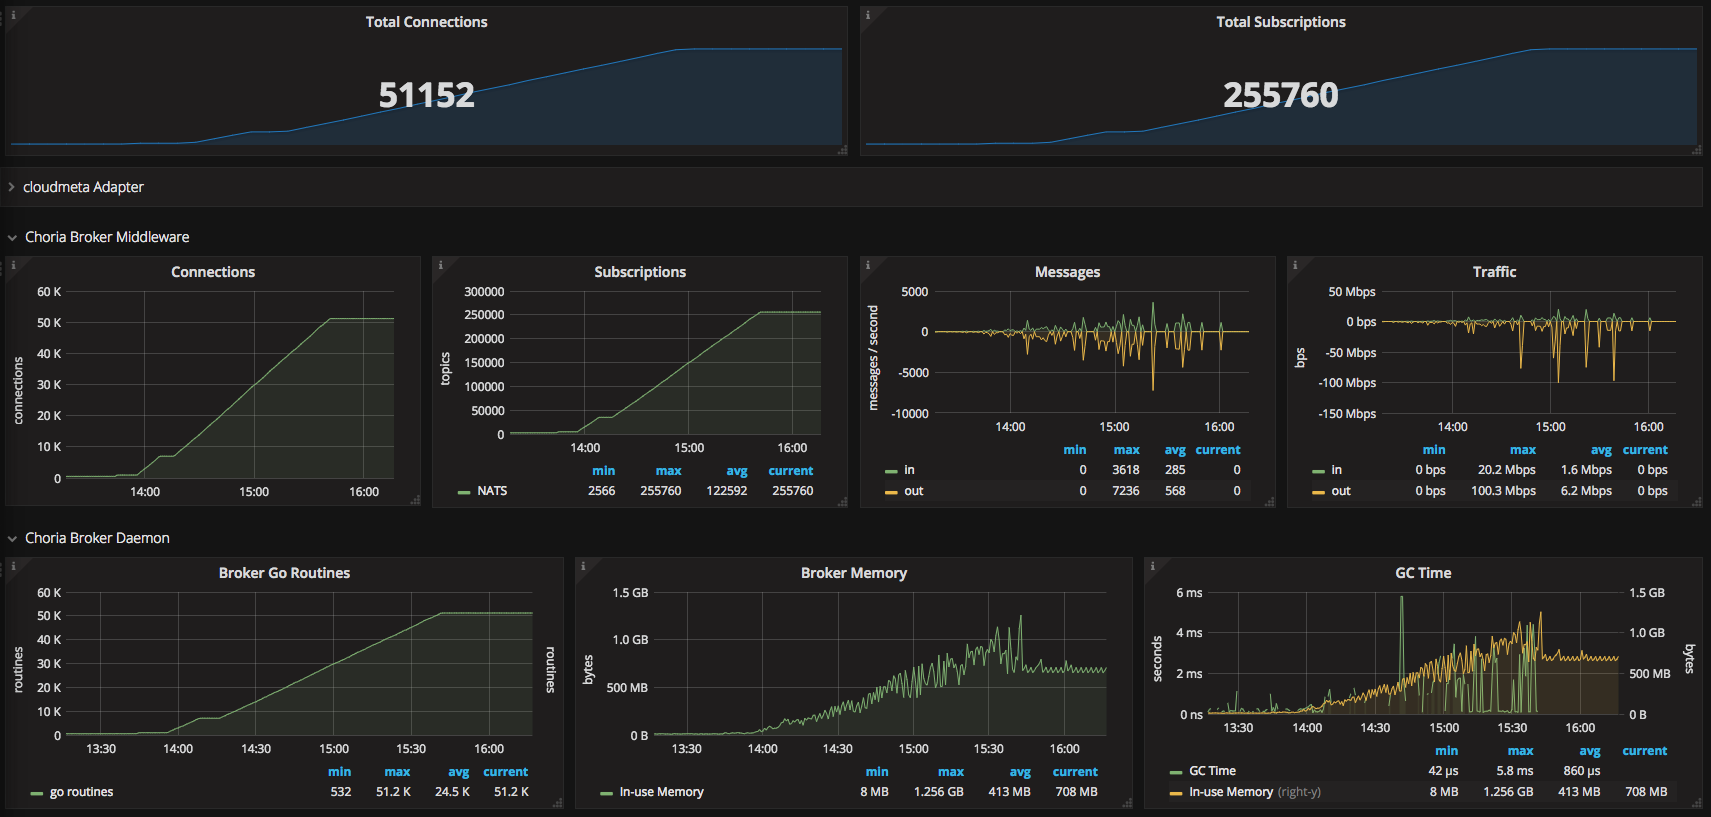
Dashboard views data created by Choria Broker when when plugin.choria.stats_port is set to a non 0 value. Prometheus metrics can be gathered on the path /choria/prometheus
Data source config
Collector type:
Collector plugins:
Collector config:
Revisions
Upload an updated version of an exported dashboard.json file from Grafana
| Revision | Description | Created | |
|---|---|---|---|
| Download |