
Netdata and prometheus
Updated Netdata dashboards for Grafana via Prometheus.
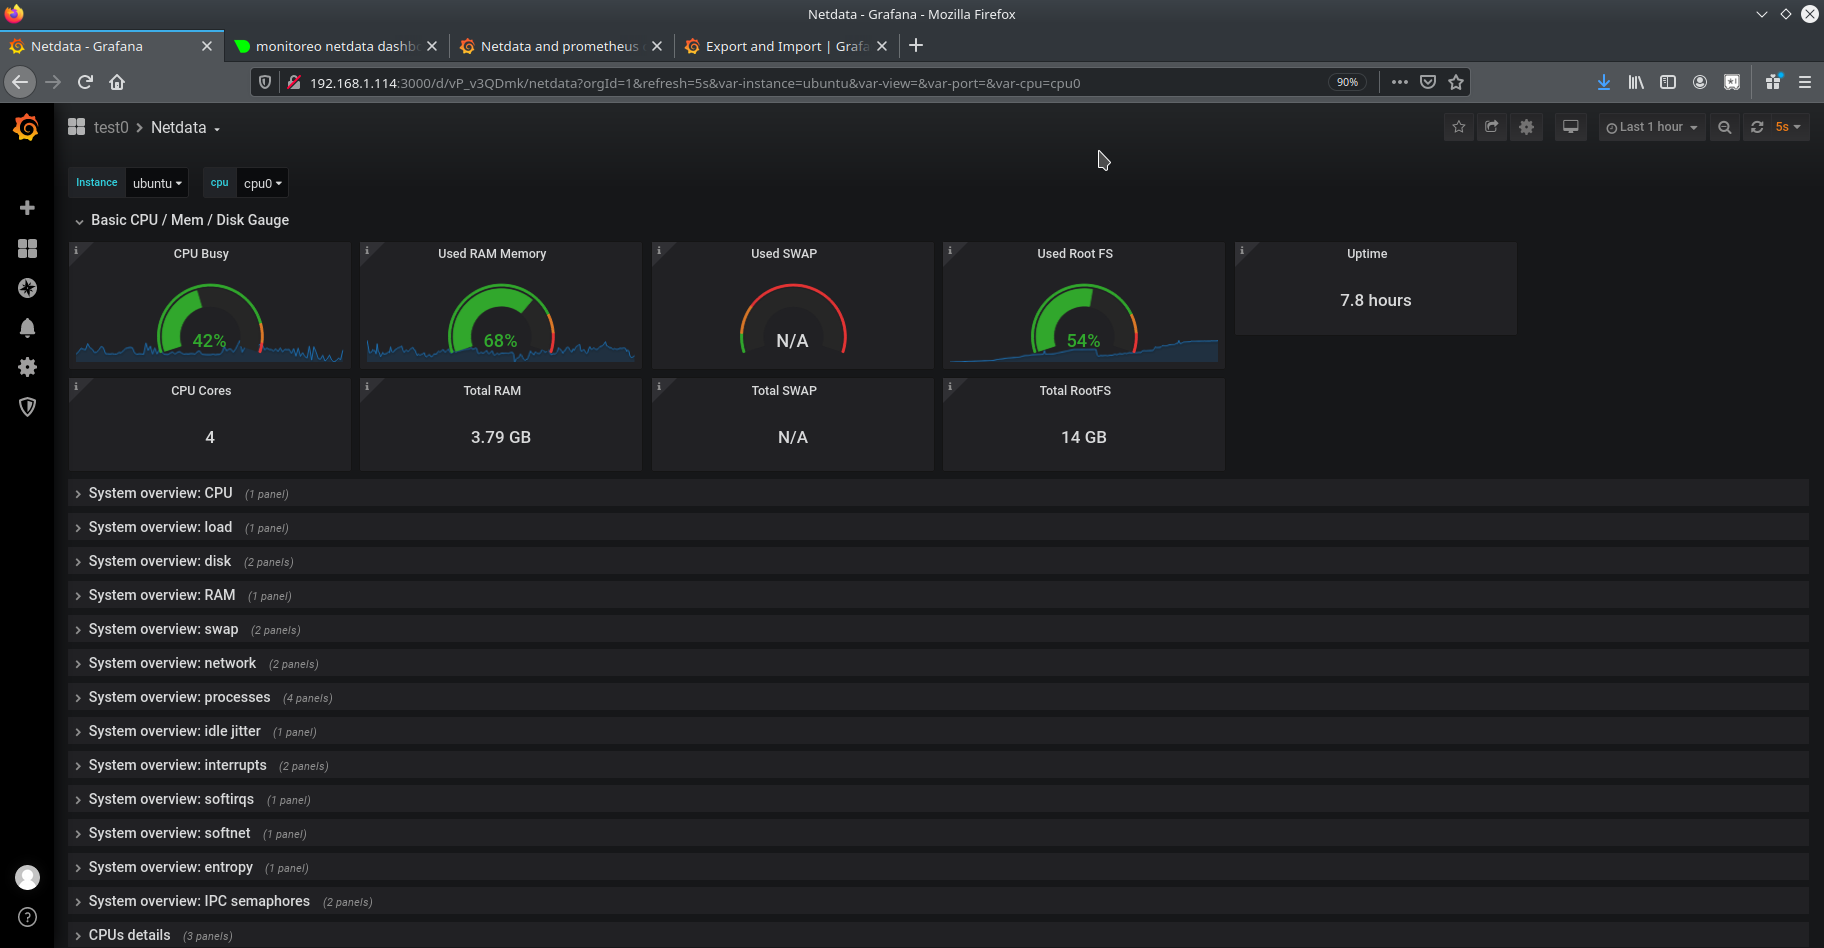
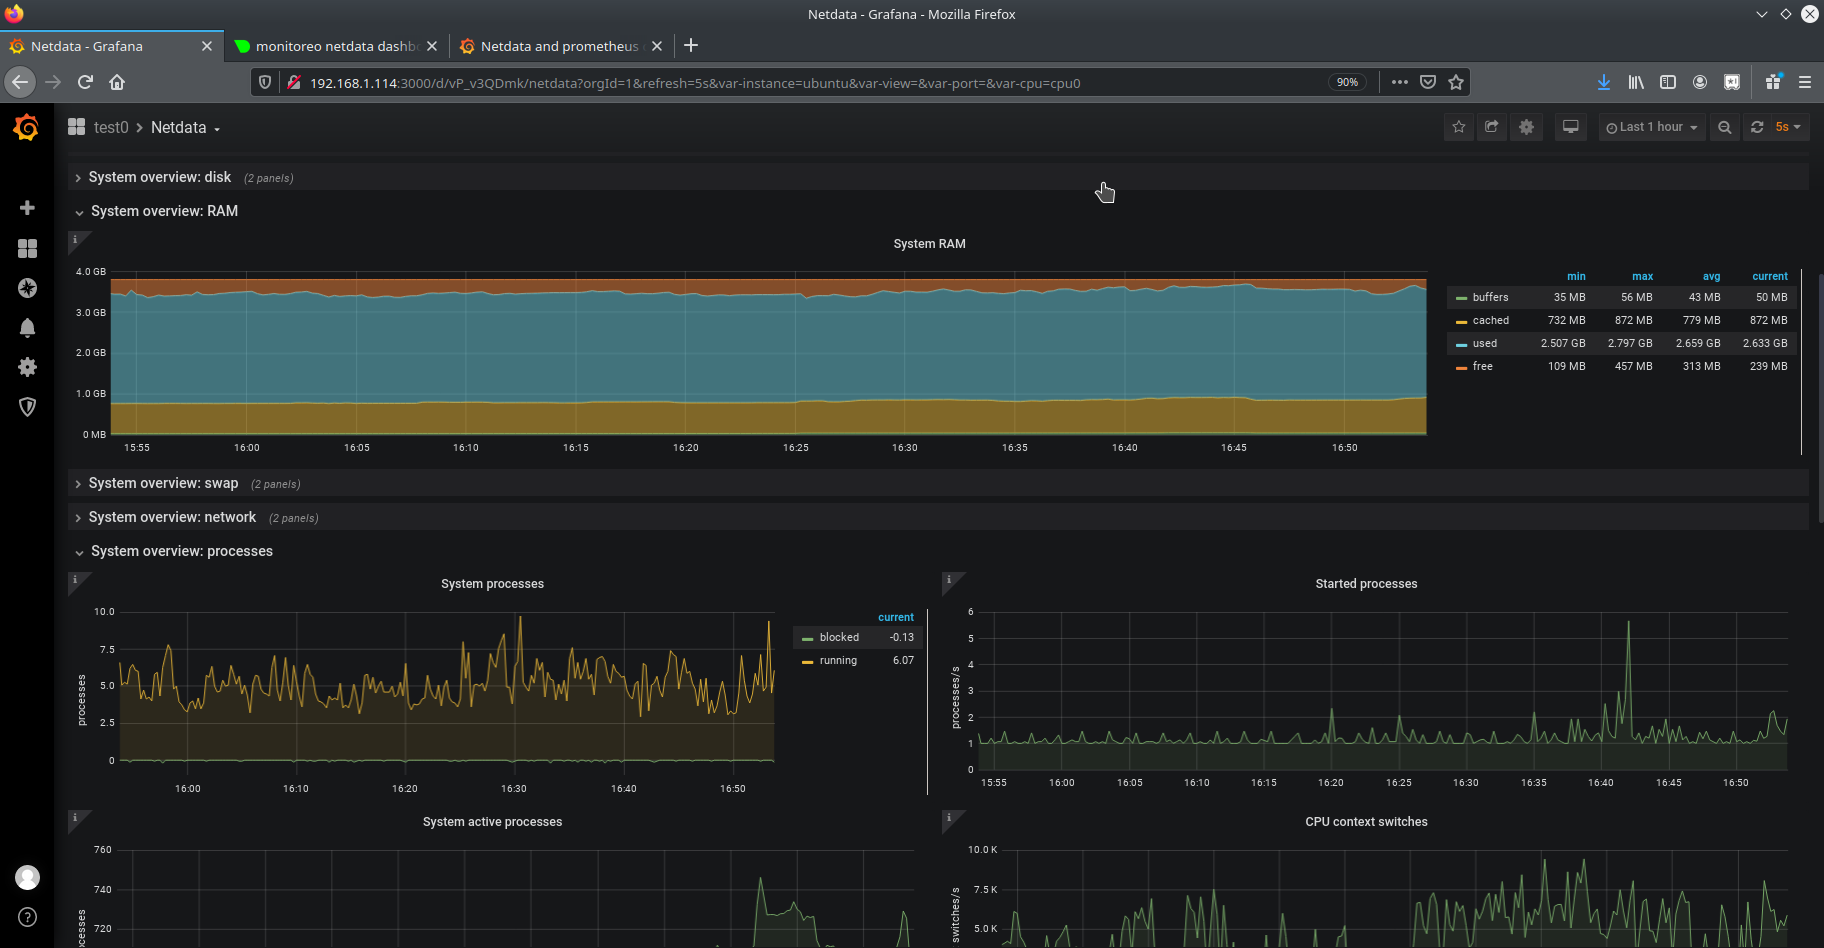
Working with grafana 6.7.3, netdata 1.22 and prometheus 2.18. This dashboard is an update from the 8055, I only updated the sources names in the query from grafana to prometheus, upgraded for grafana <3.1 versions (with the export for sharing externally option) and rearranged a few graphs to get better visibility. There are a few stats with not data collected, that's in my test environment only.
Data source config
Collector type:
Collector plugins:
Collector config:
Revisions
Upload an updated version of an exported dashboard.json file from Grafana
| Revision | Description | Created | |
|---|---|---|---|
| Download |
Metrics Endpoint (Prometheus)
Easily monitor any Prometheus-compatible and publicly accessible metrics URL with Grafana Cloud's out-of-the-box monitoring solution.
Learn more