badbread Vital Dash
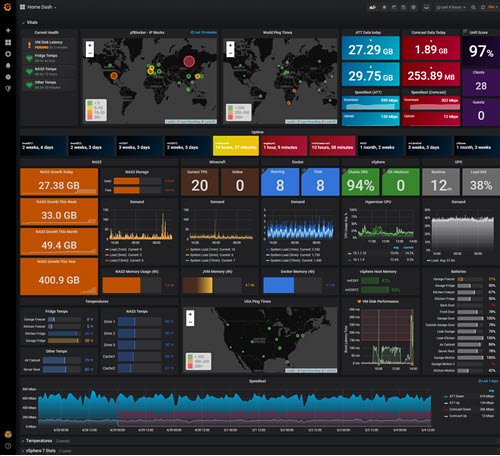
A copy of my "Vital Dashboard" aka "Home dash". PFblocker, worldping, minecraft, vsphere, Smart things (temperature sensors), apcupsd, speedtest, nas growth over time, bandwidth use over time (great for quota's), uptime monitor, unifi wifi score and users, more I'm sure it could use some polishing up, very sure of that, but enjoy none the less.
This panel is a hodge-podge of different things.
A few general notes... I tried to avoid having any yellow or "deep red" anywhere on the dash so that it's very obvious when something isn't right. All of the singlestat/bar gauges/up time/temperatures will turn yellow when something is not right, and red when it's really bad (as seen in the uptime screenshot)
The d/load & upload meters are each companies logo color for that added touch. Lookup "YOUR ISP logo colors" to get the color code and match your ISP.
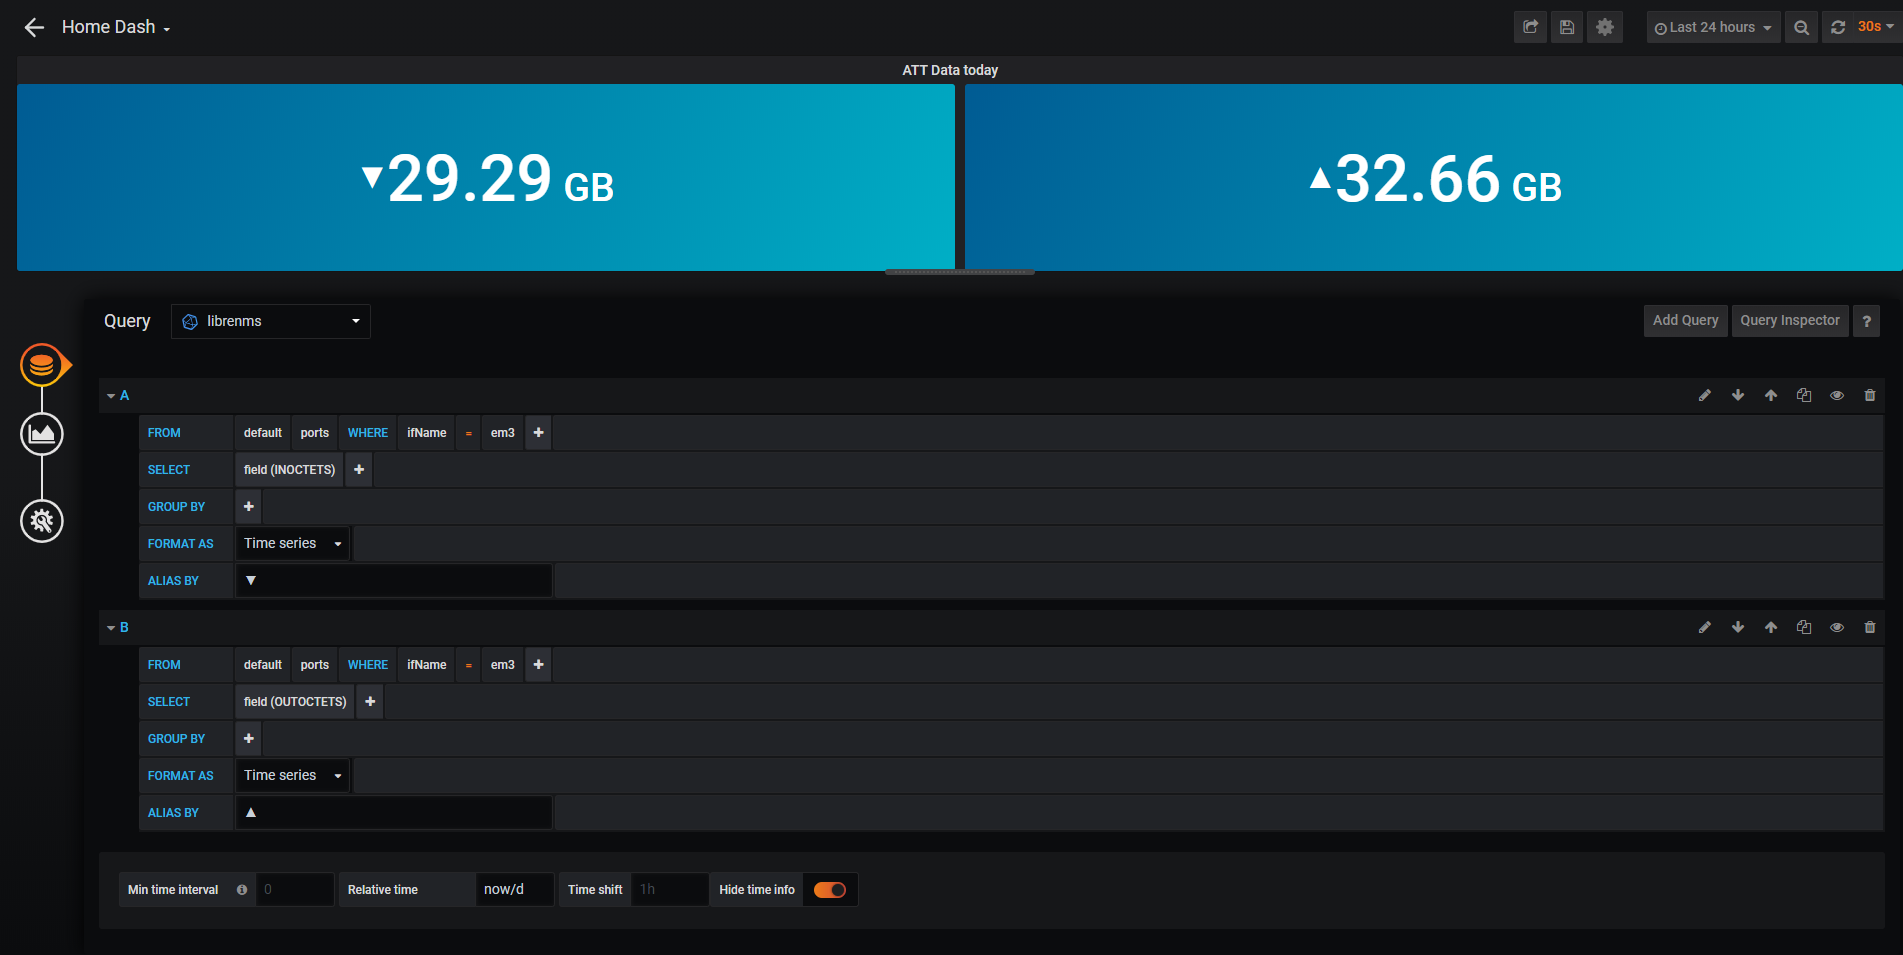
Starting up top it has pfBlocker stats from PFsense, pings various targets I defined in the world, a day by day bandwidth monitor for my 2 WAN's, and Unifi's Wifi score and number of connected clients and guests. Below that is an uptime monitor.
• In the NAS section it calculates how much the device has increased or decreased in size for the day/week/month/year. In the Minecraft section, it looks at TPS, users online, demand, and JVM memory. • In the docker section it shows running vs total machines. In my environment if they are all running that's good, so that's how I set the alert on a separate dash for this. • In the vSphere section it shows the Cluster DRS score, and any automated vMotions done that day by DRS. I also monitor VM disk performance as that is really the only bottleneck in my environment. • In the UPS section I monitor UPS load average. Below that are all the Smart Things sensor battery levels. • Temperatures shows all the Smart Things sensor temperatures and NAS device temperatures (another battle since my rack is in the garage.) The alerts for these are all on another panel as well. • USA ping times using telegraf's ping function
Note on the dual WAN thing using the docker speedtest container. I had to create a seperate docker network in order to get the traffic to route correctly to the 2nd WAN connection. In vSphere add another NIC card to your docker VM, assign that NIC to a MACVLAN in docker, then route the IP the 2nd speedtest gets via PFSense firewall rules to your other WAN connection
Data source config
Collector config:
Upload an updated version of an exported dashboard.json file from Grafana
| Revision | Description | Created | |
|---|---|---|---|
| Download |


