NVIDIA DCGM Exporter Dashboard
This dashboard is to display the metrics from DCGM Exporter on a Kubernetes (1.13+) cluster
Introduction
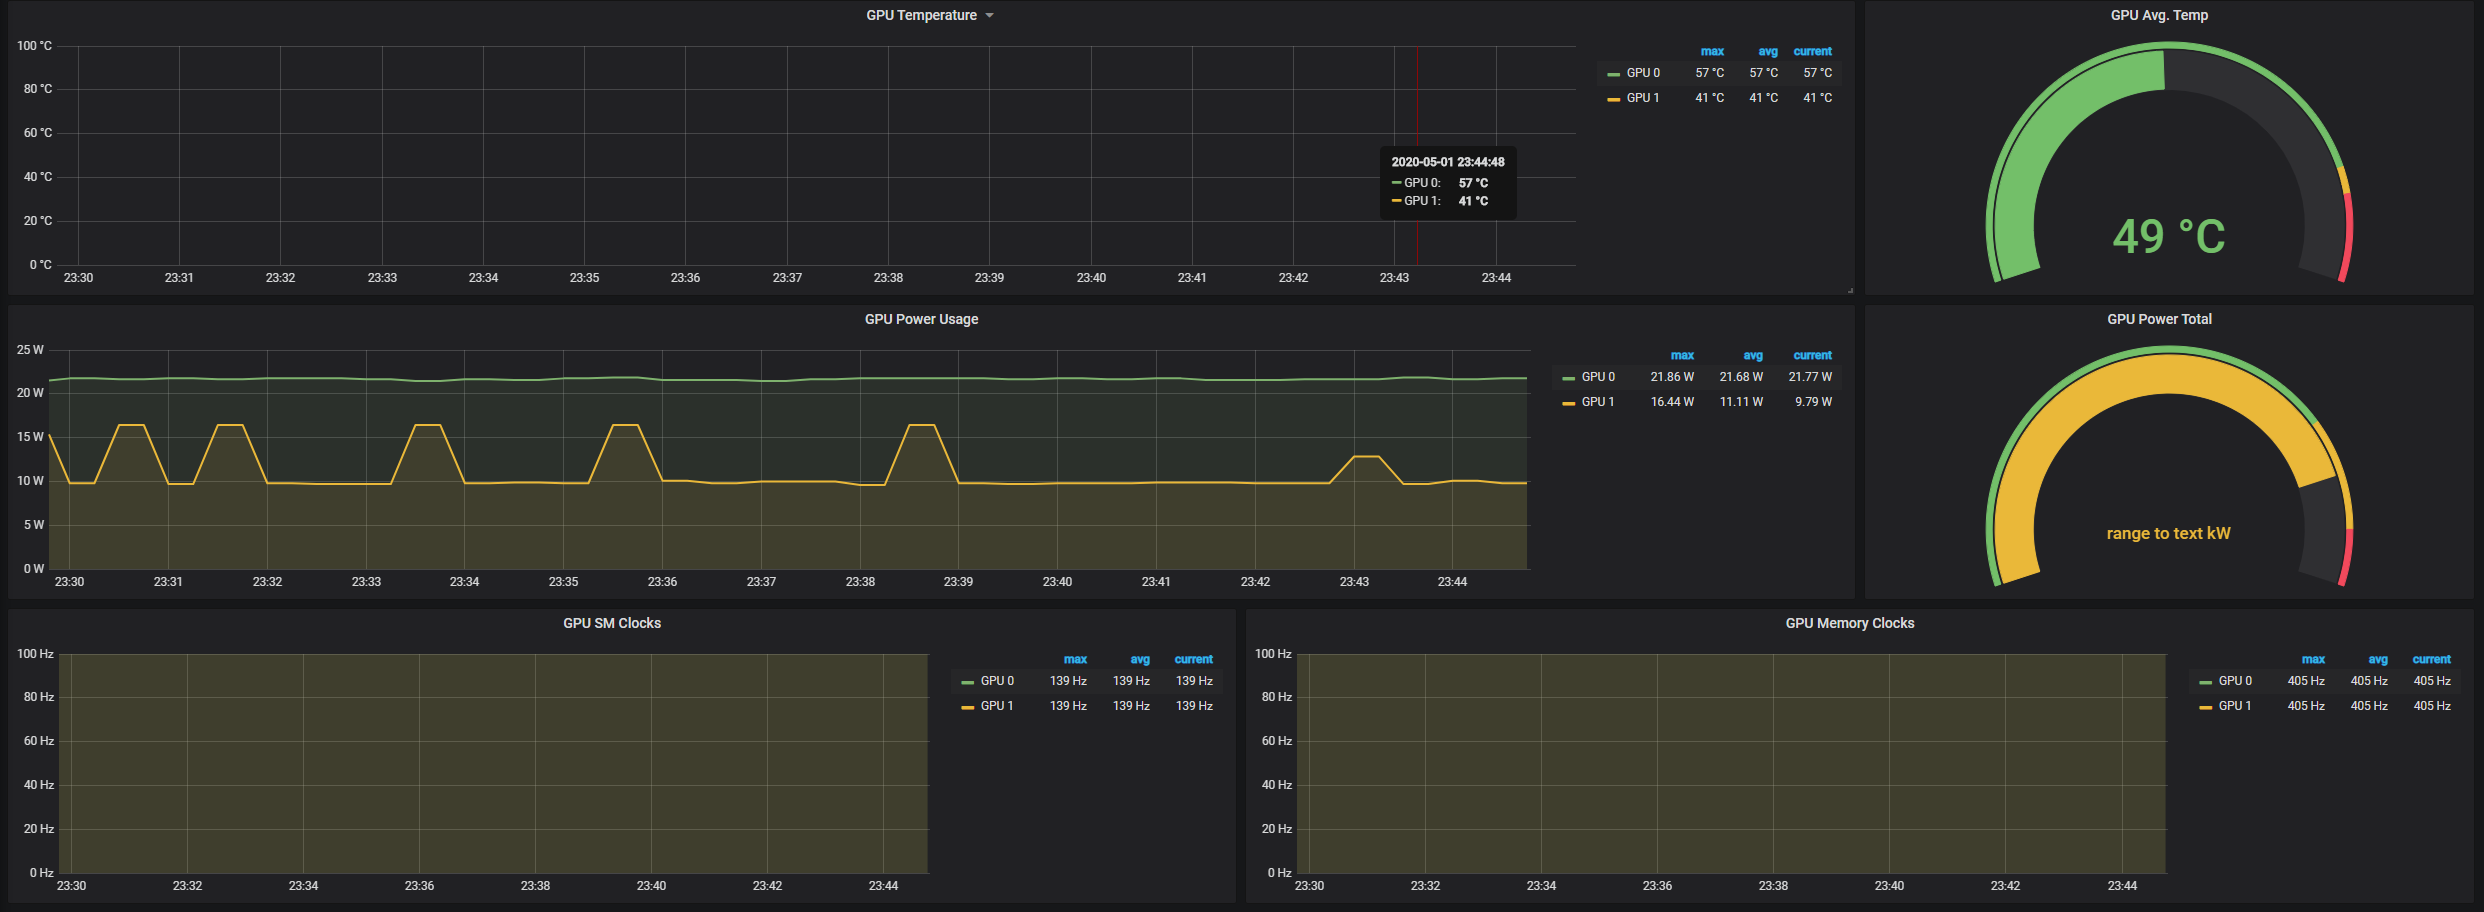
This dashboard displays GPU metrics collected from NVIDIA dcgm-exporter via a metric endpoint added to Prometheus. A separate endpoint is added to Prometheus via a Service Monitor.
Quickstart
helm install stable/prometheus-operator --generate-name \
    --set "prometheus.prometheusSpec.serviceMonitorSelectorNilUsesHelmValues=false"
kubectl create -f https://raw.githubusercontent.com/NVIDIA/gpu-monitoring-tools/2.0.0-rc.8/dcgm-exporter.yaml
kubectl create -f https://raw.githubusercontent.com/NVIDIA/gpu-monitoring-tools/2.0.0-rc.8/service-monitor.yaml
More information on the dcgm-exporter README.
Data source config
Collector type:
Collector plugins:
Collector config:
Revisions
Upload an updated version of an exported dashboard.json file from Grafana
| Revision | Description | Created | |
|---|---|---|---|
| Download |