Grafana Dashboard for Wordpress.com Jetpack Analytics
Grafana Dashboard for Wordpress.com Jetpack Analytics
Just download the latest Wordpress.com Jetpack script version from GitHub https://github.com/jorgedlcruz/wordpress-grafana/raw/master/wordpress_grafana.sh and change the Configuration section within your details:
##
# Configurations
##
# Endpoint URL for InfluxDB
InfluxDBURL="YOURINFLUXSERVERIP" #Your InfluxDB Server, http://FQDN or https://FQDN if using SSL
InfluxDBPort="8086" #Default Port
InfluxDB="telegraf" #Default Database
InfluxDBUser="USER" #User for Database
InfluxDBPassword="PASSWORD" #Password for Database
Endpoint URL for login action
WPSiteURL="YOURSITE"
WPAuthBearer="YOURAUTHCODE"
Once the changes are done, make the script executable with chmod:
chmod +x wordpress_grafana.sh
The output of the command should be something like the next, without errors:
HTTP/1.1 204 No Content
Content-Type: application/json
Request-Id: 9ba3716e-8868-11ea-ad9d-0050569002da
X-Influxdb-Build: OSS
X-Influxdb-Version: 1.7.10
X-Request-Id: 9ba3716e-8868-11ea-ad9d-0050569002da
Date: Mon, 27 Apr 2020 09:22:25 GMT
If so, please now add this script to your crontab, like for example every 30 minutes:
*/30 * * * * /home/oper/wordpress_grafana.sh >> /var/log/wordpress-stats.log 2>&1
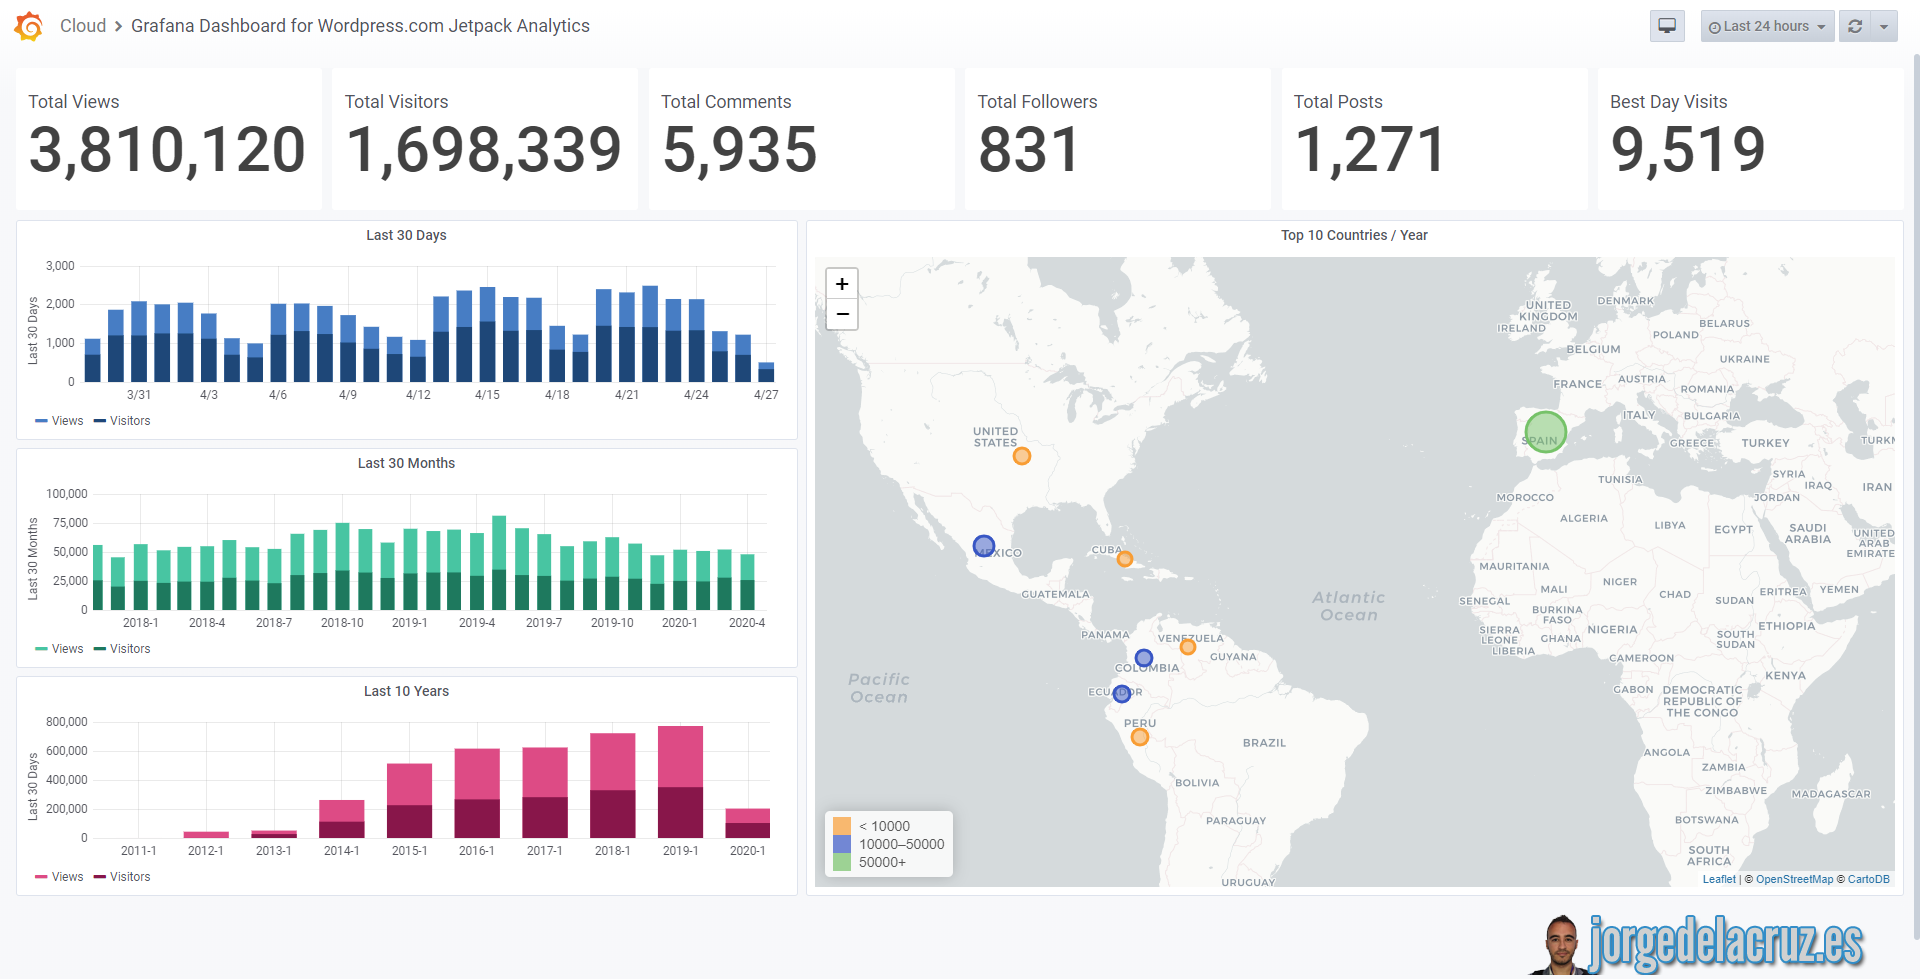
Then download or import this Dashboard to your Grafana, and you should see something similar to the next:

Data source config
Collector config:
Upload an updated version of an exported dashboard.json file from Grafana
| Revision | Description | Created | |
|---|---|---|---|
| Download |
Adobe Analytics
With the Grafana plugin for Adobe Analytics, you can quickly visualize and query your Adobe Analytics data from within Grafana.
Learn more