
System Dashboard (Telegraf + Netdata)
InfluxDB dashboards for telegraf metrics + netdata Pressure Stall Information
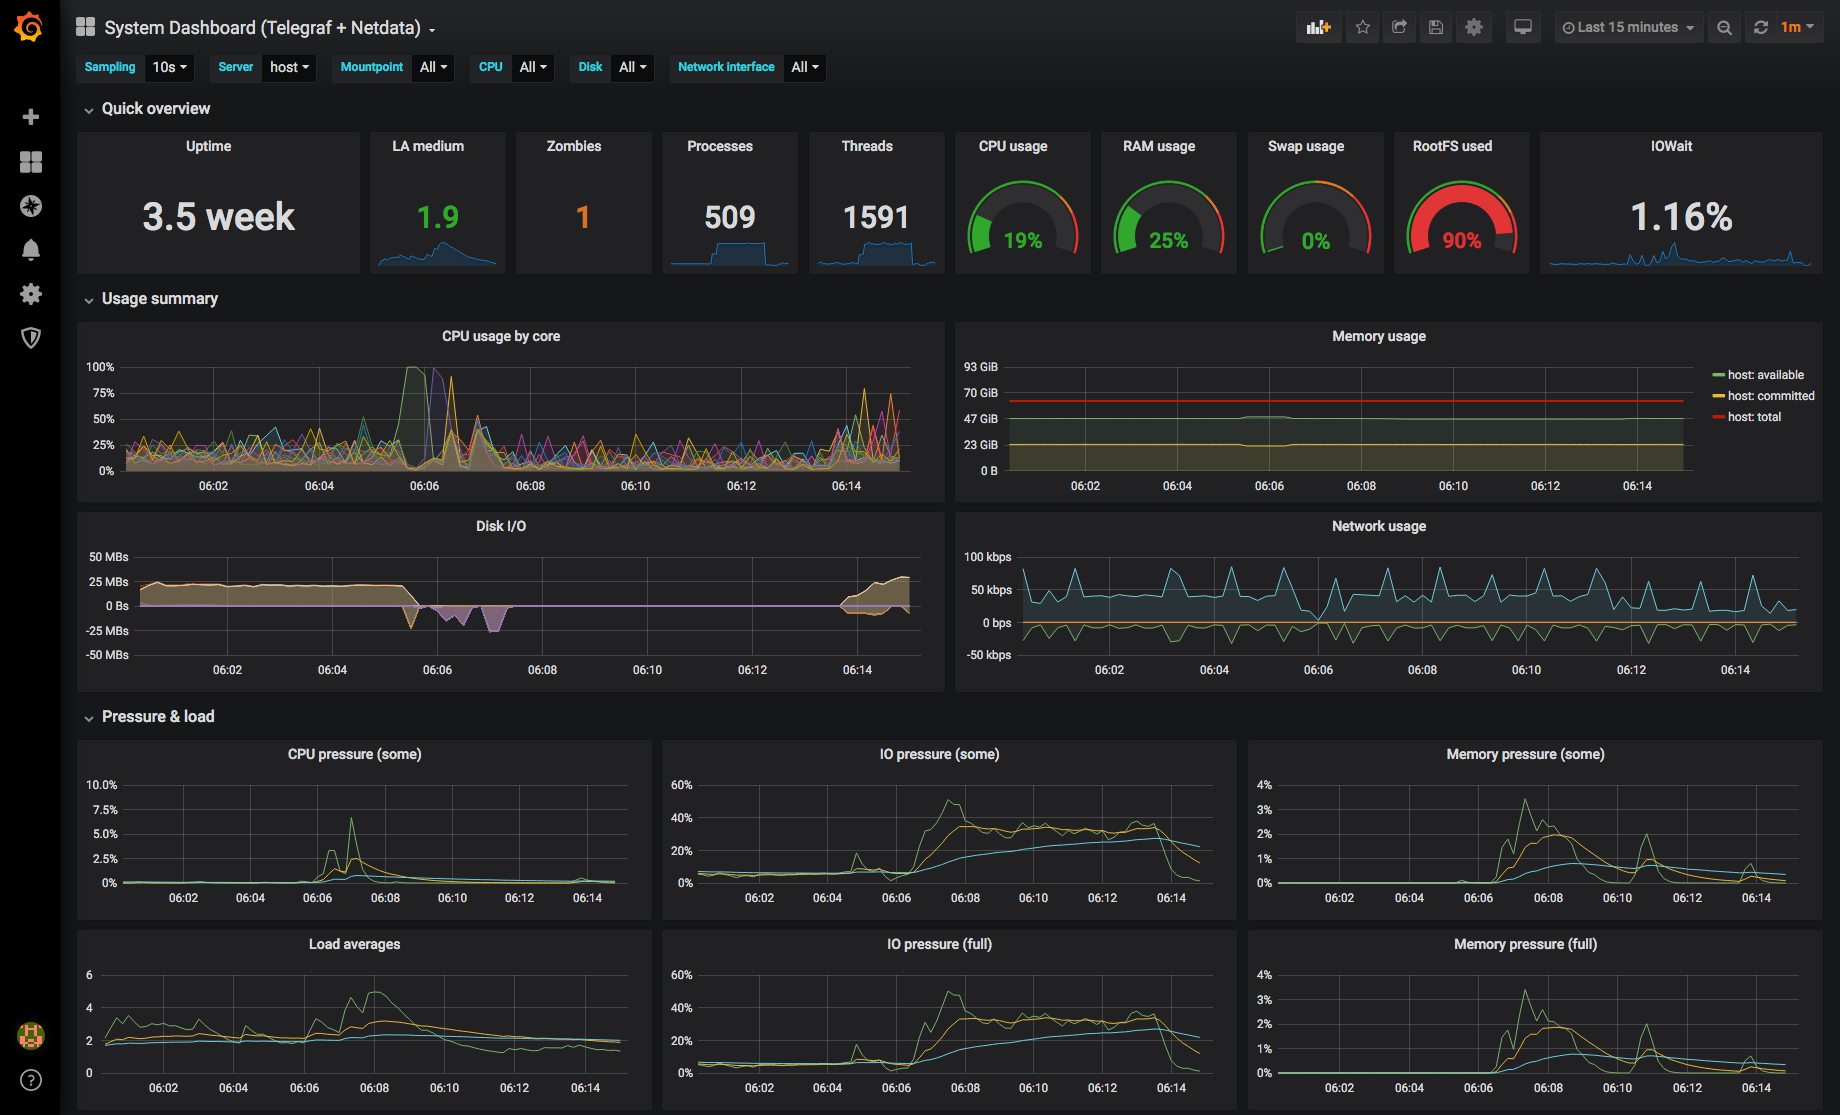
System Dashboard: Telegraf + Netdata
Based on https://grafana.com/grafana/dashboards/928, with tweaks.
The first page is a condensed system summary, including:
- CPU usage by core in single graph
- Memory usage (using the
Committed_ASandAvailablevalues, which are more useful for overviews) - Disk I/O for all disks in a single graph
- Network usage
- Linux Pressure Stall Information (PSI), collected by Netdata
Tweaks to the original dashboard:
- Display gaps for missing data in graphs: https://github.com/influxdata/influxdb/issues/7185#issuecomment-349024751
- Use
$__intervalinstead of the deprecated$interval - Avoid
NON_NEGATIVE_DERIVATIVE()where not needed - Singlestat panels that show guages are migrated to Guage panels
The influxdb datasource variables $telegraf and $netdata are hidden by default. To change them after importing the dashboard, open the dashboard settings, go to the variables section, click on the variable, change the "hide" selection box to the empty value, and click update. When you return to the dashboard, the variable will be modifiable at the top of the dashboard next to the other variables.
Data source config
Collector type:
Collector plugins:
Collector config:
Revisions
Upload an updated version of an exported dashboard.json file from Grafana
| Revision | Description | Created | |
|---|---|---|---|
| Download |