
Kubernetes apiserver
Latency and cache hit graphs for Kubernetes apiserver. Useful for observing performance of Amazon EKS clusters.
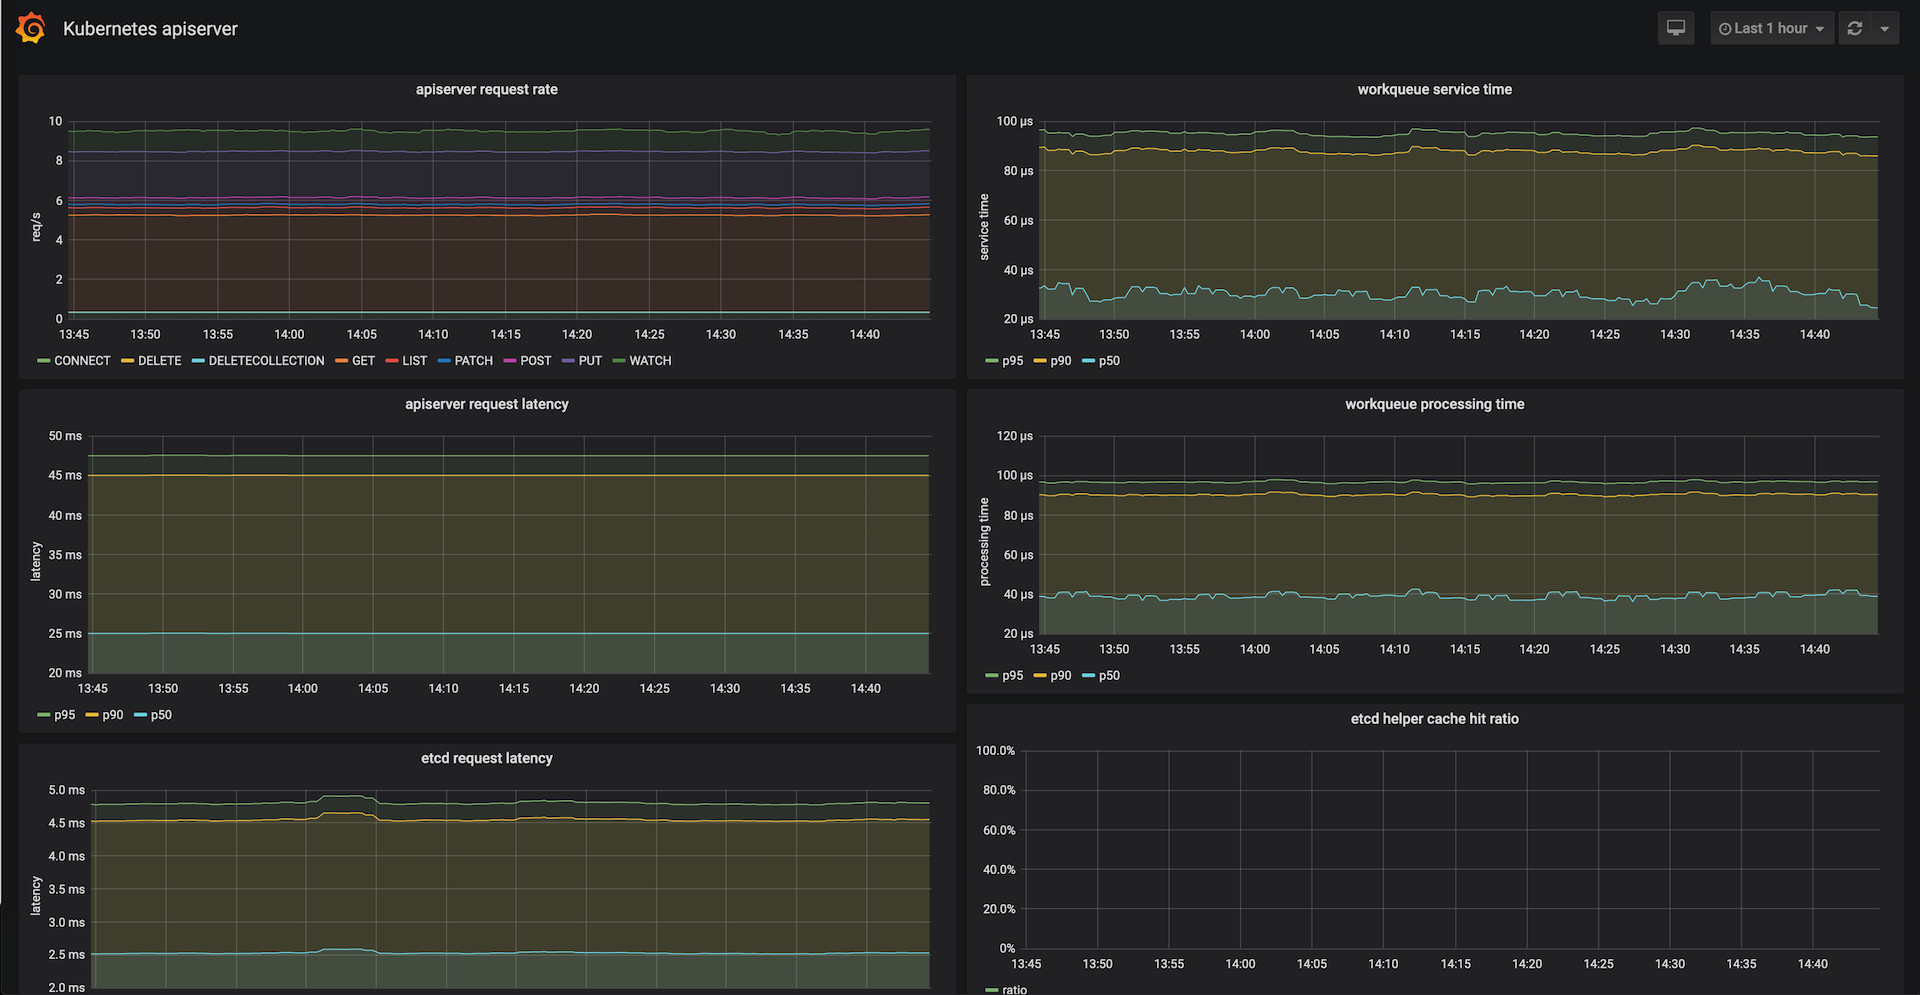
This dashboard helps visualize Kubernetes apiserver performance. It provides several metrics including:
- apiserver request rates
- apiserver and etcd request latencies (p95, p90, p50)
- workqueue latencies (p95, p90, p50)
- etcd cache hit rate
It has been tested with Kubernetes 1.15. It may be compatible with newer releases as well, but is not guaranteed.
Data source config
Collector type:
Collector plugins:
Collector config:
Revisions
Upload an updated version of an exported dashboard.json file from Grafana
| Revision | Description | Created | |
|---|---|---|---|
| Download |
Kubernetes
Monitor your Kubernetes deployment with prebuilt visualizations that allow you to drill down from a high-level cluster overview to pod-specific details in minutes.
Learn more