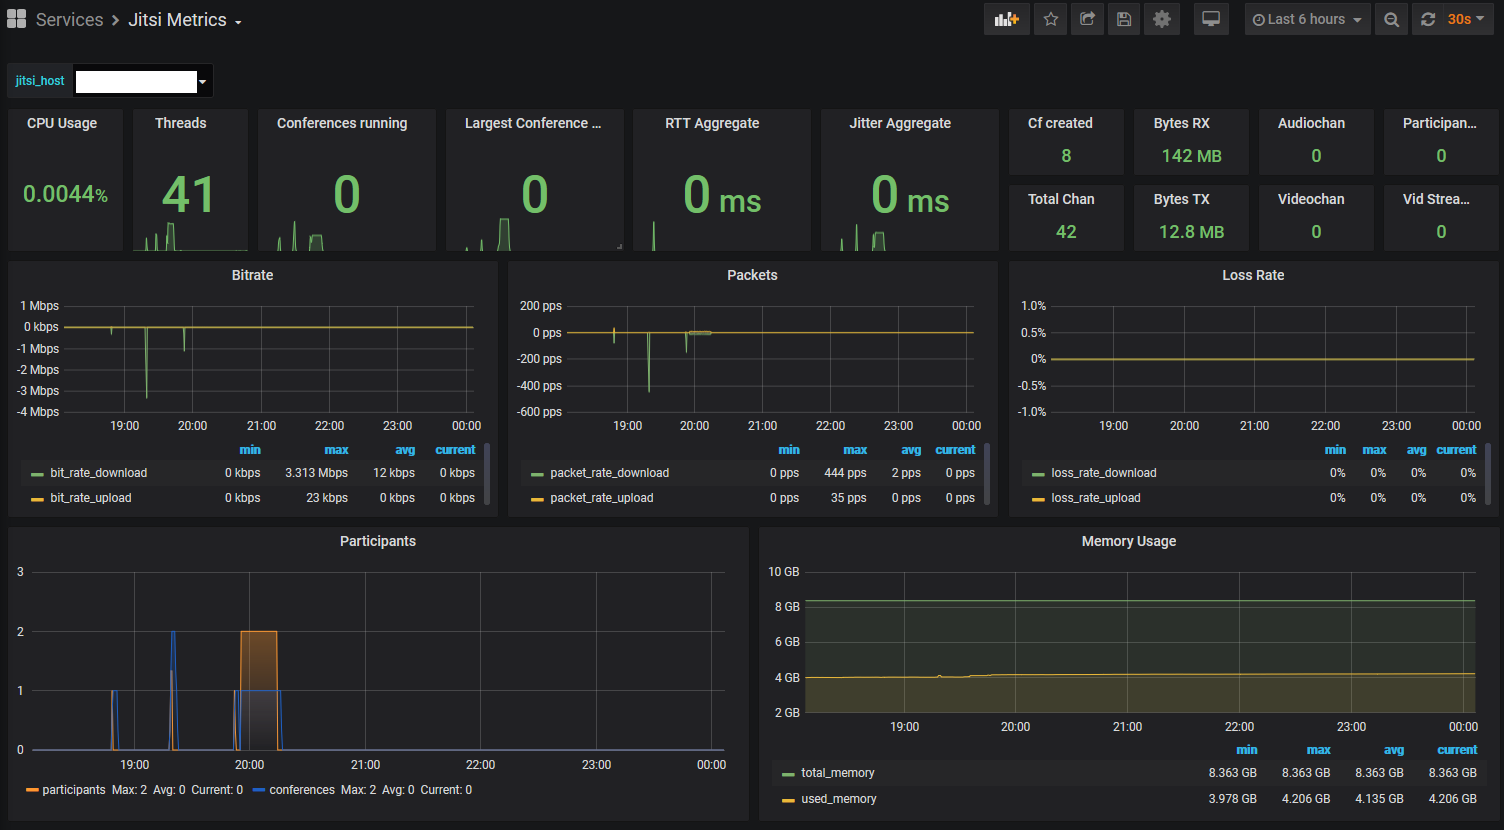
Jitsi Metrics
Videoconferencing Performance Metrics
Changes:
CPU and Memory usage have been removed since they're no longer reported by the API. This is due a Jitsi Change.
Howto:
- Get JVB Metrics exposed. Enable the Colibri and REST API in JVB for that. In a common docker setup you would set JVB_ENABLE_APIS=rest,colibri.
Additionally you may want to expose port 8080 in your docker-compose.yml for service JVB. Care for security and Firewall that port if you don't want dragons from the Internet to read your metrics.
- Put the config below in your telegraf config tree (eg.
/etc/telegraf/telegraf.d/jitsi.conf) + reload telegraf - Download the dashboard template, import it to your grafana instance and assign the matching InfluxDB datasource
- See nice numbers and graphs.
Data source config
Collector type:
Collector plugins:
Collector config:
Revisions
Upload an updated version of an exported dashboard.json file from Grafana
| Revision | Description | Created | |
|---|---|---|---|
| Download |