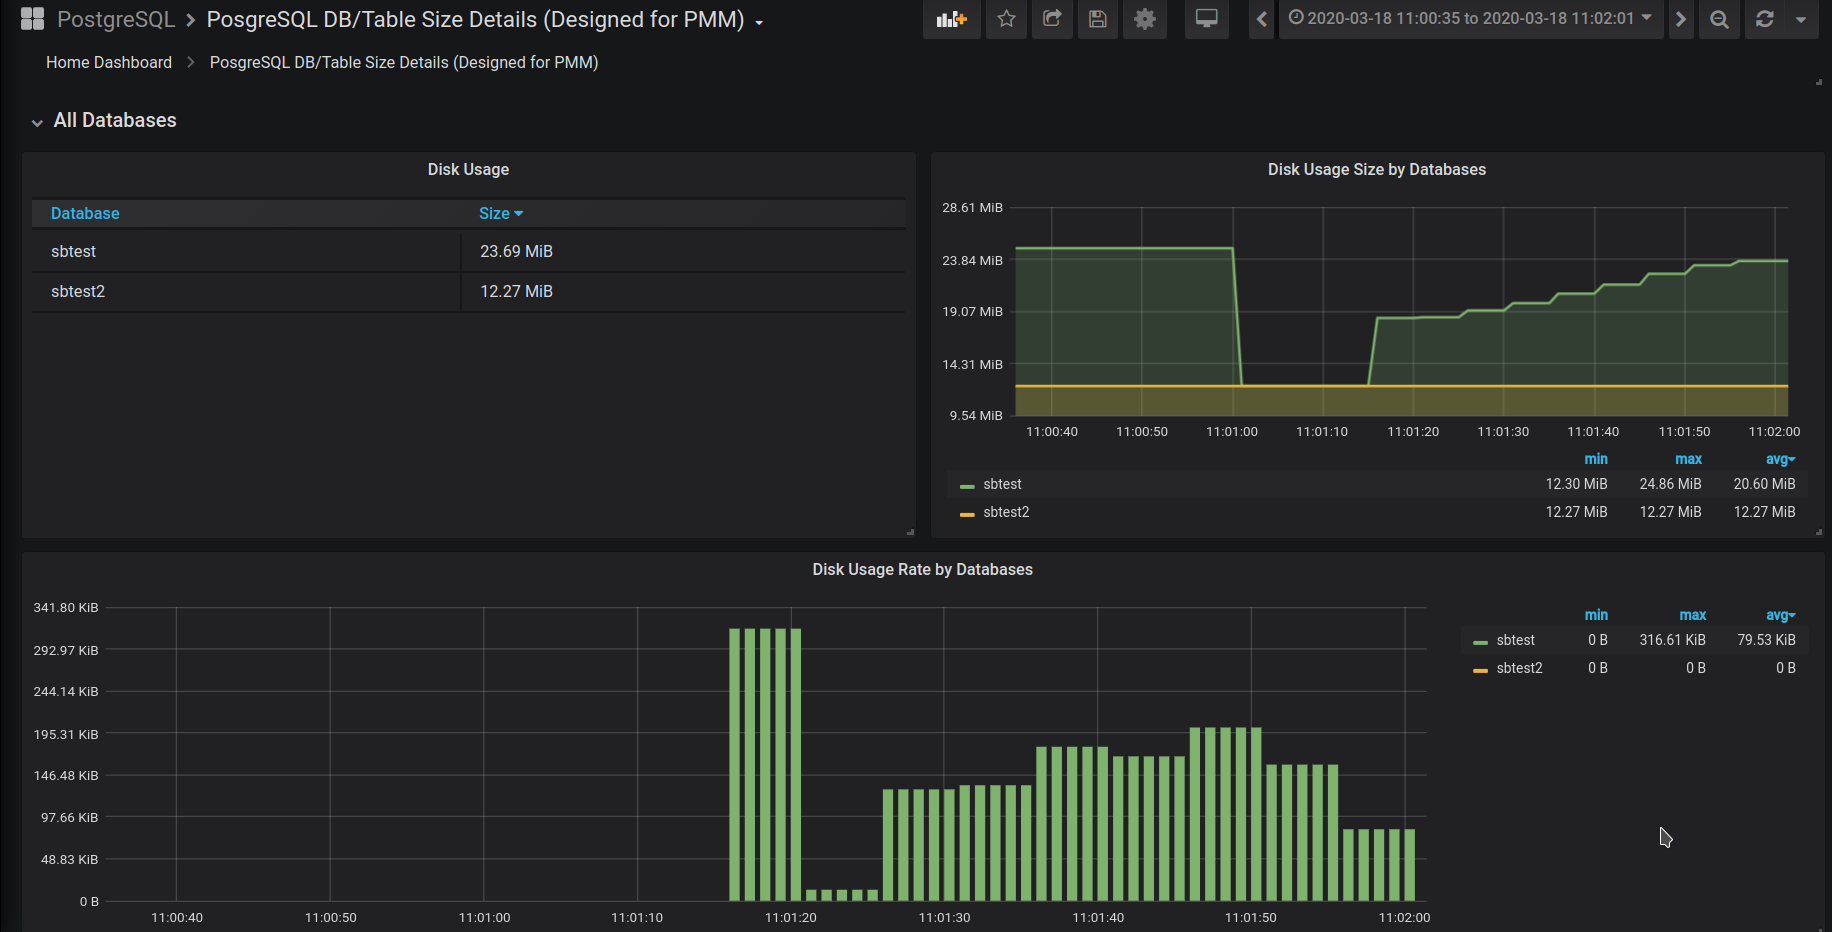
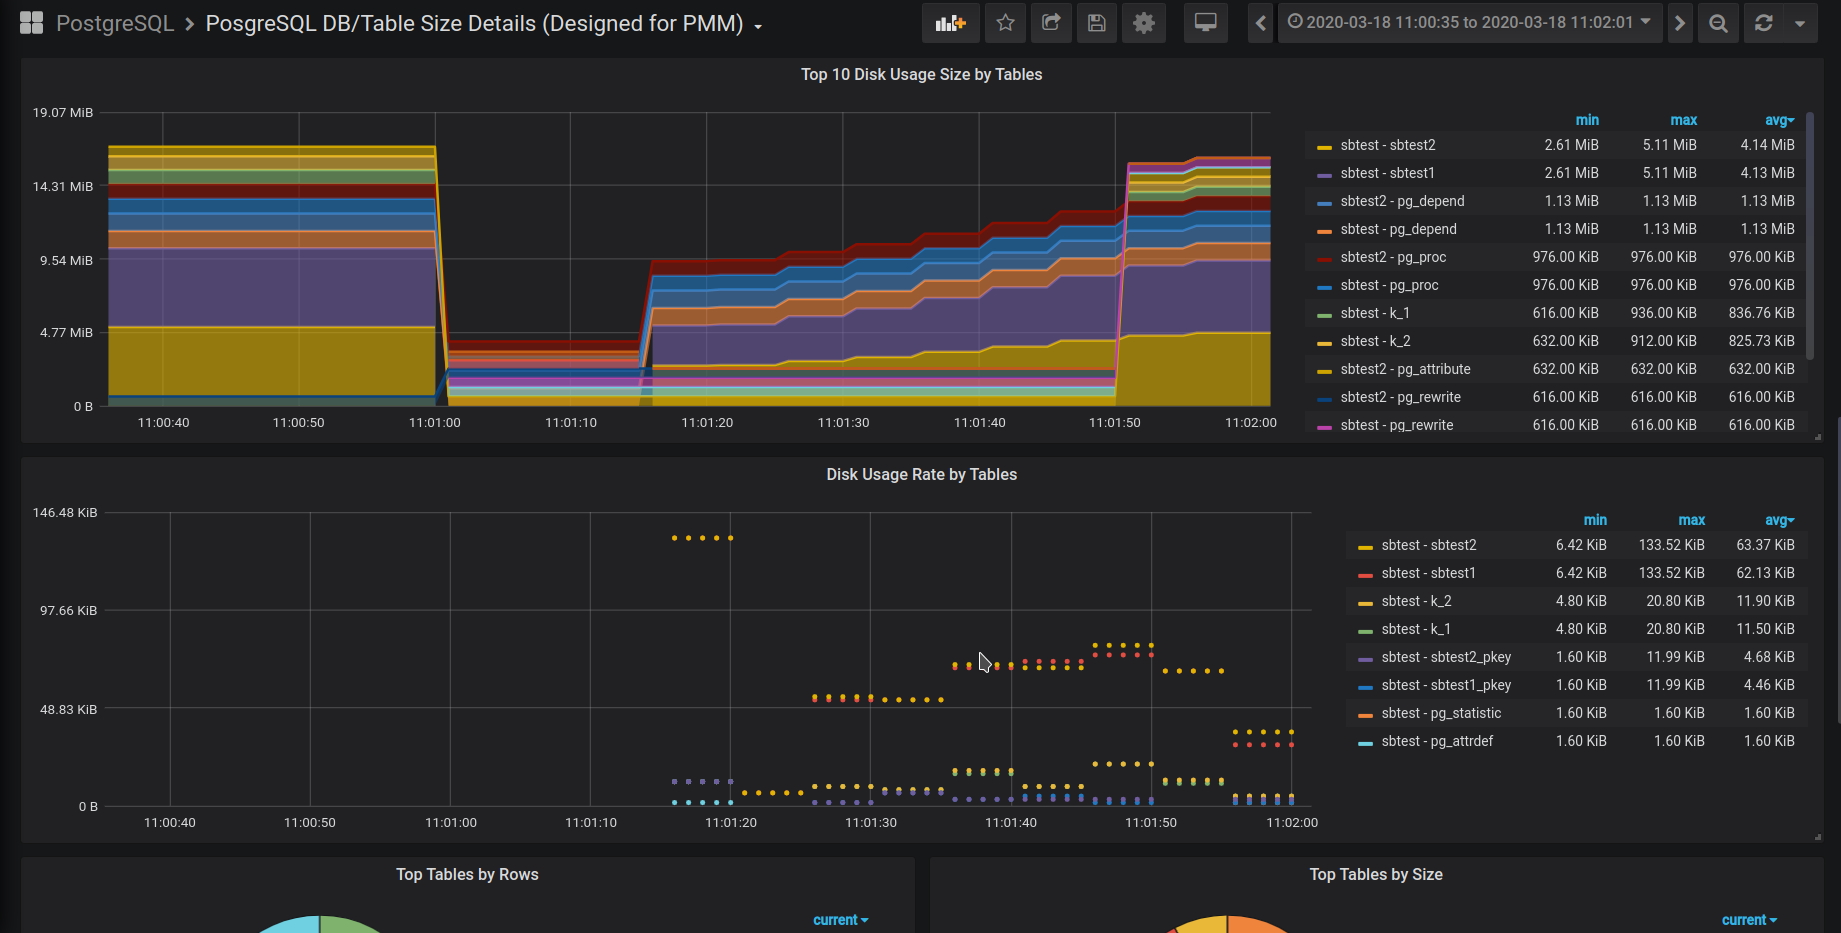
PosgreSQL DB/Table Size Details (Designed for PMM)
We take a look at using an catalog called pg_class. The catalog pg_class catalogs tables and most everything else that has columns or is otherwise similar to a table. This includes indexes, sequences, views, materialized views, composite types, and TOAST tables.
The dashboard is prepared for PMM2.
Metrics are collected by a custom query. It's used postgresql_exporter (https://github.com/percona/postgres_exporter). So we need create a file with a custom query. Postgresql exporter is processing custom queries files by default. So you should place your file into one of next path refer to a desired scraping interval and restart the exporter.
/usr/local/percona/pmm2/collectors/custom-queries/postgresql/low-resolution
/usr/local/percona/pmm2/collectors/custom-queries/postgresql/medium-resolution
/usr/local/percona/pmm2/collectors/custom-queries/postgresql/high-resolution
We propose to use our bash script (https://gist.github.com/adivinho/12641a0d2fda105c00e5aa6bf2bdce09) that generates a query and forms other fields for a custom query file. You have to specify the database name, or names, that will be monitored. You can store the result of the script in a separate file or can extend an existing file with queries.
$ ./postgres_query_size_generator.sh sbtest sbtest2 >> queries-postgres-2.yml
Next metrics are collected:
- pg_class_table_rows
- pg_class_disk_usage_table_bytes
- pg_class_disk_usage_index_bytes
- pg_class_disk_usage_toast_bytes
Data source config
Collector config:
Upload an updated version of an exported dashboard.json file from Grafana
| Revision | Description | Created | |
|---|---|---|---|
| Download |


