Container CPU Usage vs Throttling Percentage
Detect/Diagnose CPU throttling for containers
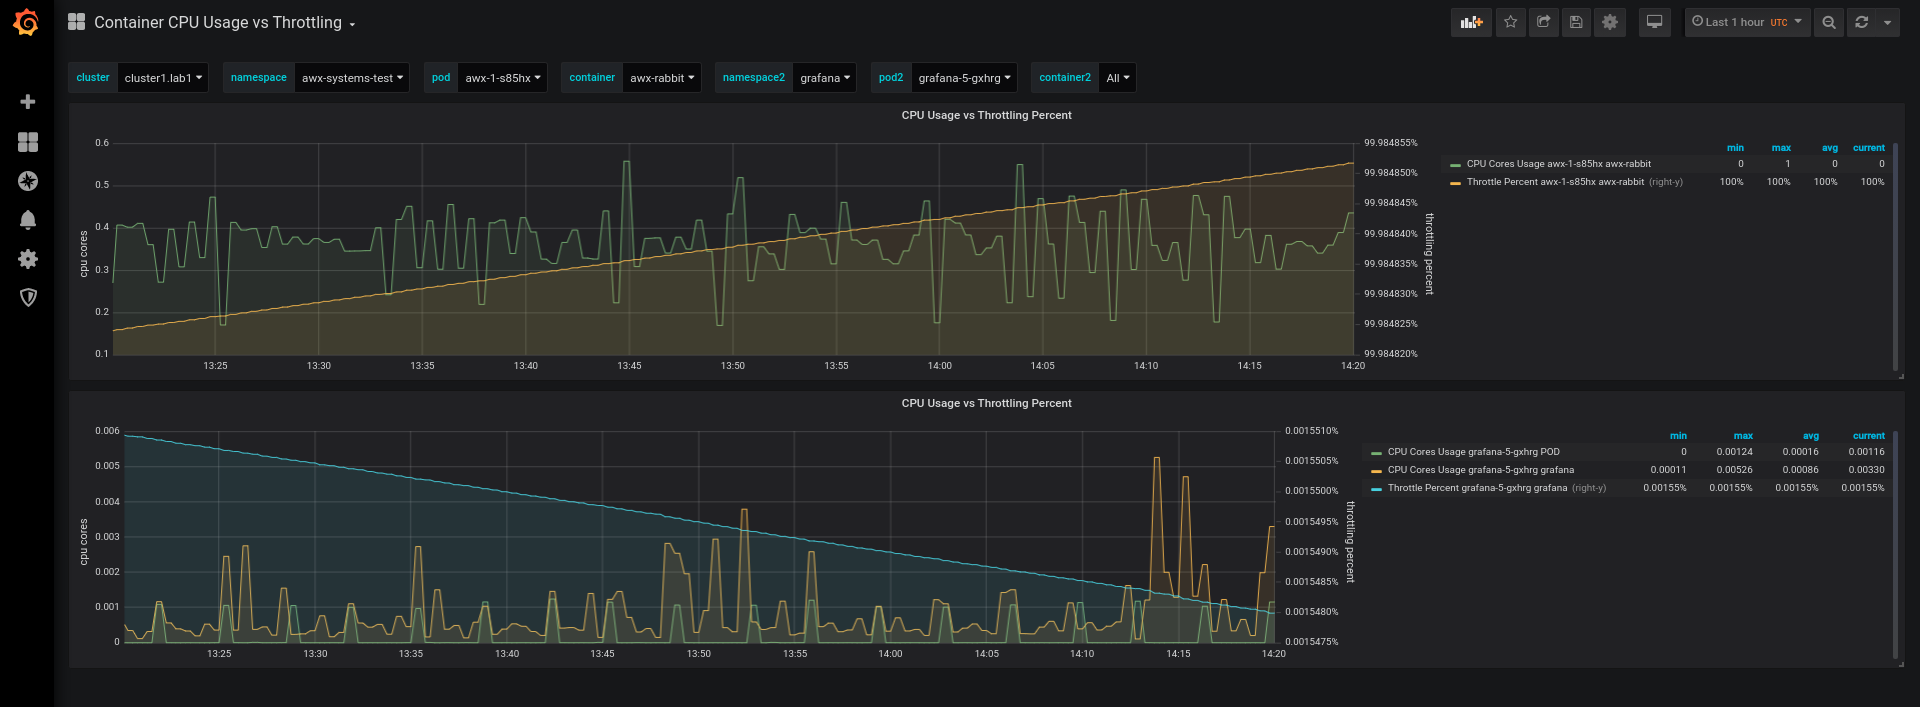
This dashboard has two panes to view Container CPU and Container Percent Throttling on the same graph. This allows you to see containers which could be subject to CFS throttling and could require their CPU limits increased.
Data source config
Collector type:
Collector plugins:
Collector config:
Revisions
Upload an updated version of an exported dashboard.json file from Grafana
| Revision | Description | Created | |
|---|---|---|---|
| Download |