Redis Dashboard for Prometheus Redis Exporter (helm stable/redis-ha)
Redis Dashboard for Prometheus Redis Exporter 1.x, it works with helm stable/redis-ha exporter. If you missing redis memory utilization, please modify "maxmemory" value in values.yaml
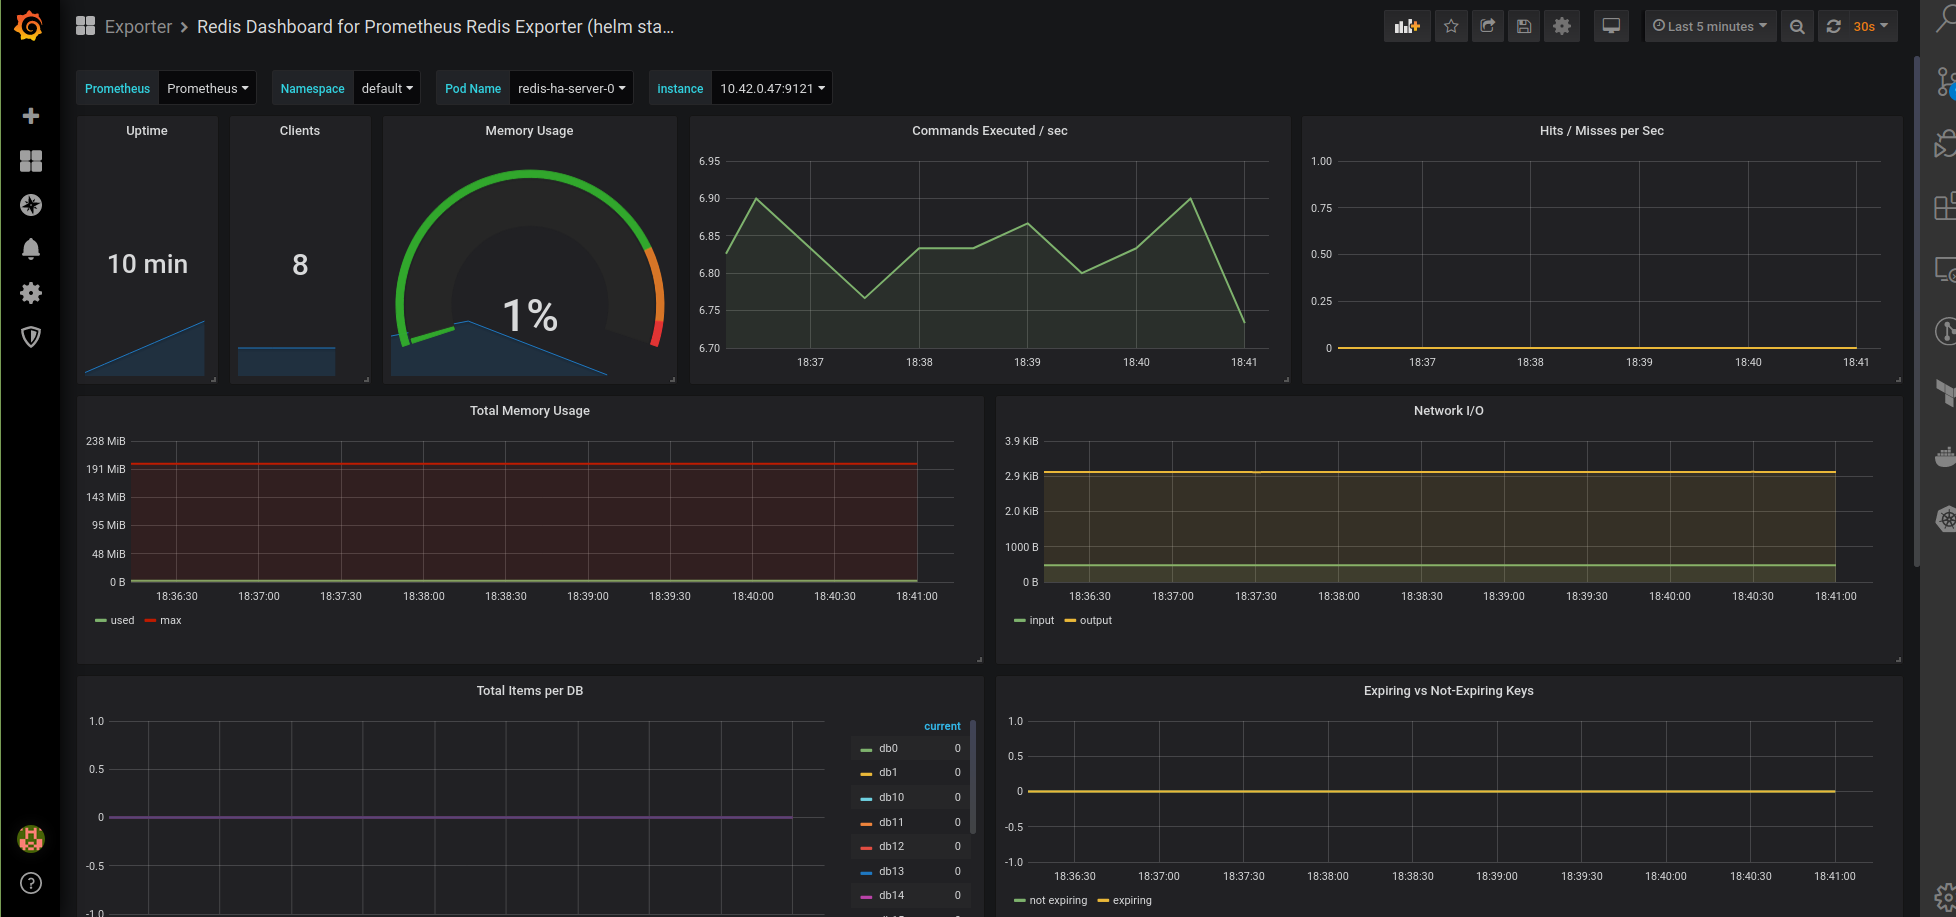
The Redis Dashboard for Prometheus Redis Exporter (helm stable/redis-ha) dashboard uses the prometheus data source to create a Grafana dashboard with the graph and singlestat panels.
Data source config
Collector type:
Collector plugins:
Collector config:
Revisions
Upload an updated version of an exported dashboard.json file from Grafana
| Revision | Description | Created | |
|---|---|---|---|
| Download |
Metrics Endpoint (Prometheus)
Easily monitor any Prometheus-compatible and publicly accessible metrics URL with Grafana Cloud's out-of-the-box monitoring solution.
Learn more