1 Kubernetes cluster overview(कुबरनेटेस)
This dashboard can help troubleshooting issue in k8s cluster at cluster, node and namespace level.
Prometheus helm chart used: stable/prometheus-operator@8.13.8. Grafana version recommended: 7.0.0 or higher Latest k8s version tested upon: v1.20.2
For latest dashboard please visit the git repo: dguyhasnoname
Special Plugin dependencies:
- Status dot
- single stat
values.yaml for operator helm chart:
prometheusOperator:
createCustomResource: true
alertmanager:
ingress:
enabled: true
hosts: [alertmanager.abc.com]
grafana:
image:
repository: grafana/grafana
tag: 7.0.3
ingress:
enabled: true
hosts: [grafana.abc.com]
plugins:
- btplc-status-dot-panel
prometheus:
ingress:
enabled: true
hosts: [prometheus.abc.com]
prometheusSpec:
replicas: 1
podAntiAffinity: hard
podAntiAffinityTopologyKey: failure-domain.beta.kubernetes.io/zone
storageSpec:
volumeClaimTemplate:
spec:
storageClassName: default-storage-class
accessModes: ["ReadWriteOnce"]
resources:
requests:
storage: 70Gi
resources:
requests:
cpu: 200m
memory: 1024Mi
limits:
cpu: 1000m
memory: 1024Mi
Exporters
kubeApiServer:
enabled: true
kubelet:
enabled: true
kubeControllerManager:
enabled: true
coreDns:
enabled: true
kubeDns:
enabled: true
kubeEtcd:
enabled: true
kubeScheduler:
enabled: true
kubeProxy:
enabled: true
kubeStateMetrics:
enabled: true
nodeExporter:
enabled: true
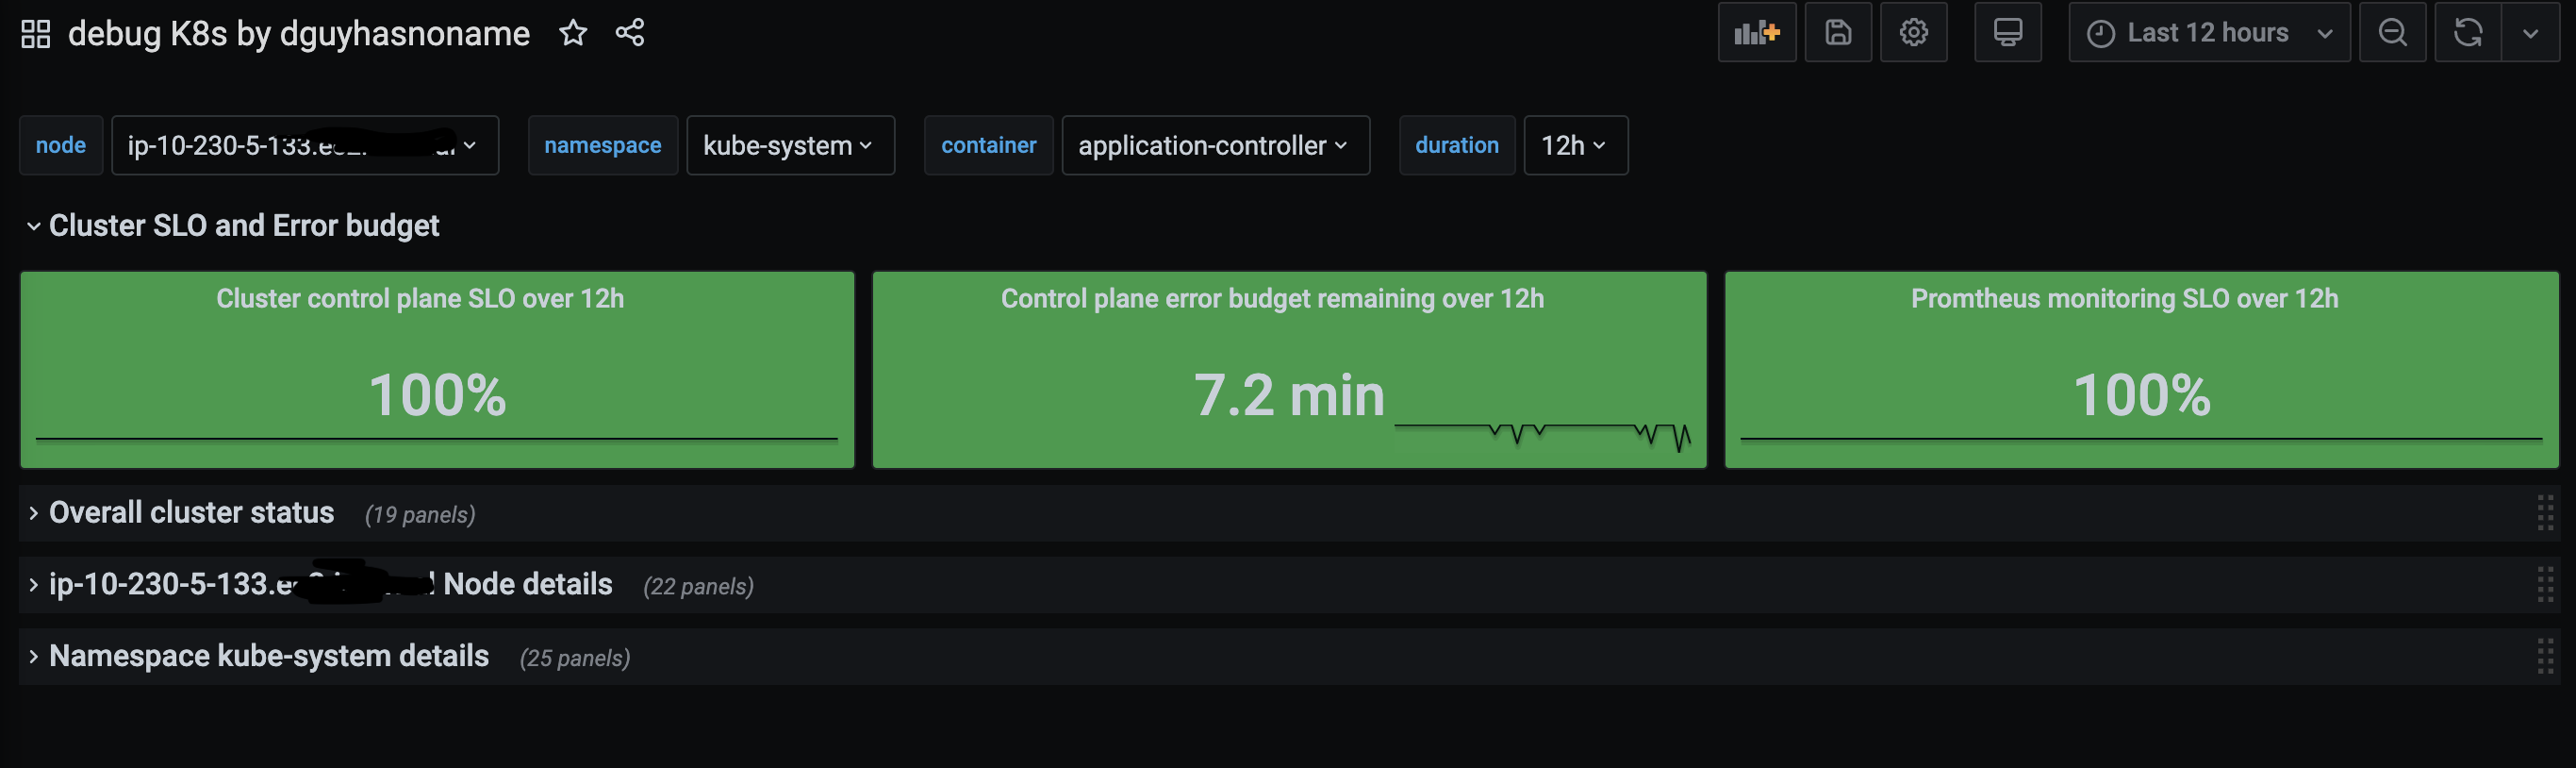
This dashboard show SLO and error budget for over all cluster/namespace and can help troubleshooting issue in k8s cluster at cluster, node and namespace level.
Cluster SLO and error budget has been calculated based on control plane pods. Namespace SLO and error budget is based on all pods running in the namespace.
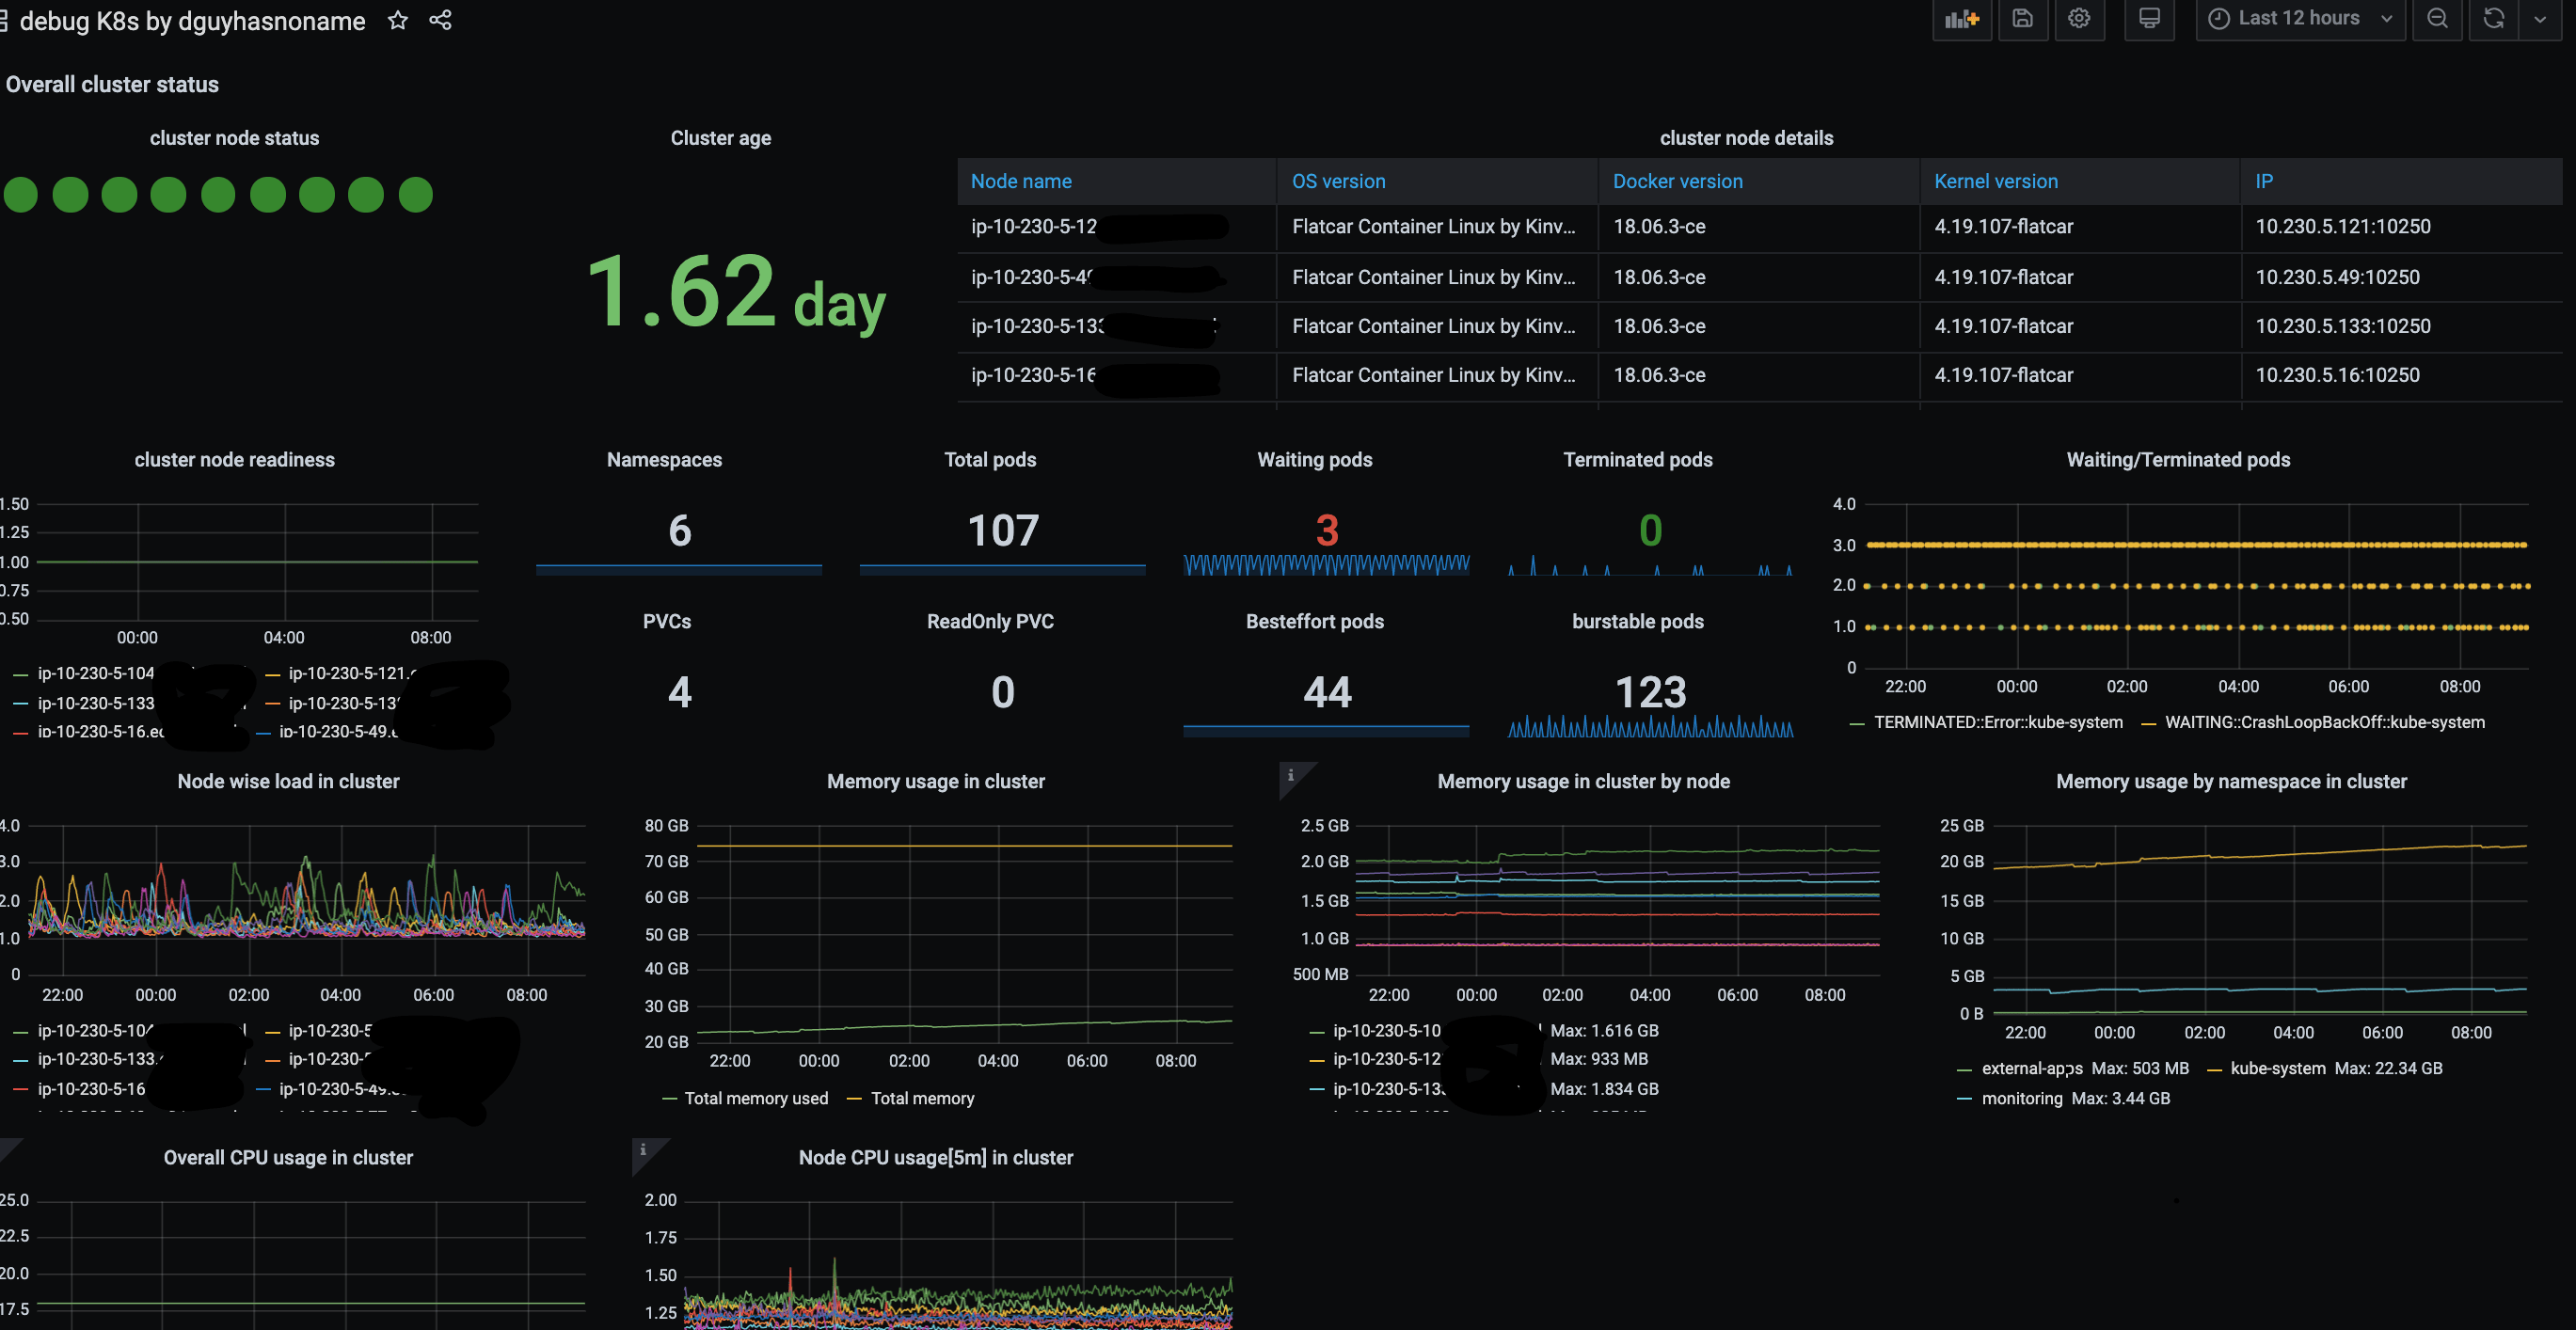
At cluster level you can find below details:
- Node readiness state
- No. of pods in cluster
- memory/CPU usage in cluster: total, node-wise and namespace wise.
- PVCs in cluster and read only PVCs
- Cluster age
- Waiting/Teminated pods count
- cluster node details
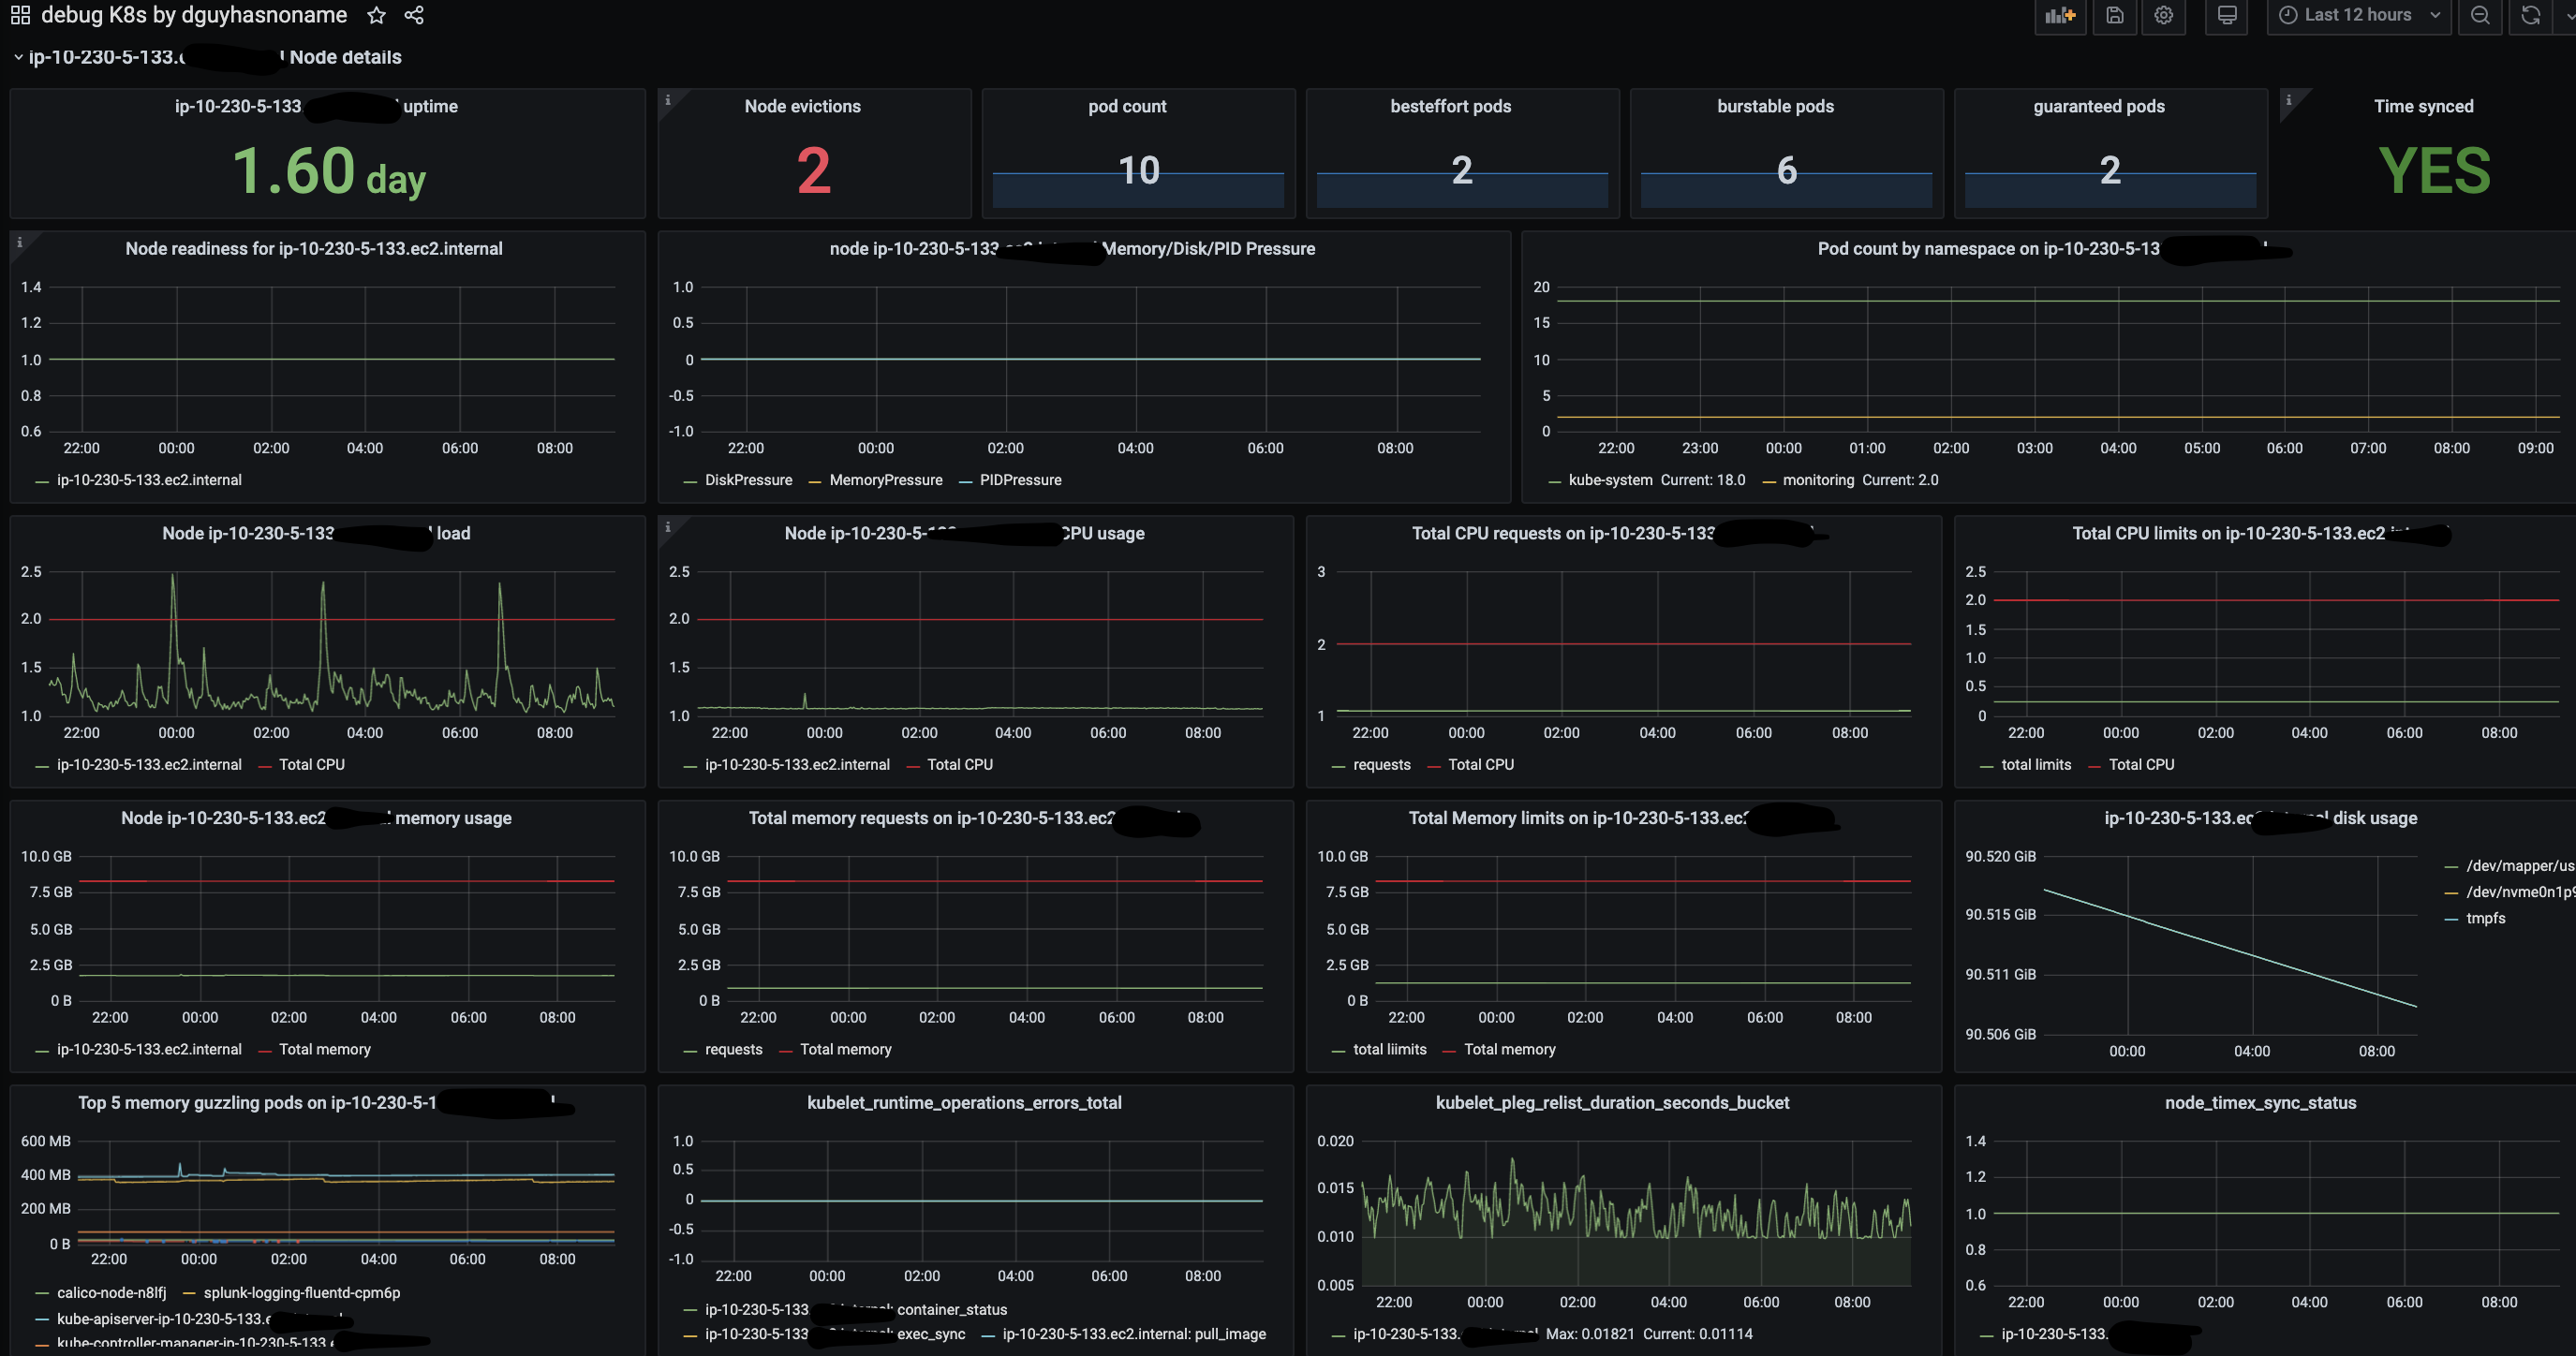
At node level you can find below details:
- Uptime
- Node readiness
- CPU, memory and load on node.
- Kubelet errors which can be related to PLEG
- pod count on node by namespace
- Memory/Disk/PID pressure
- Top 5 memory guzzling pods
- NTP time deviation
- Kubelet eviction stats
- Node evictions
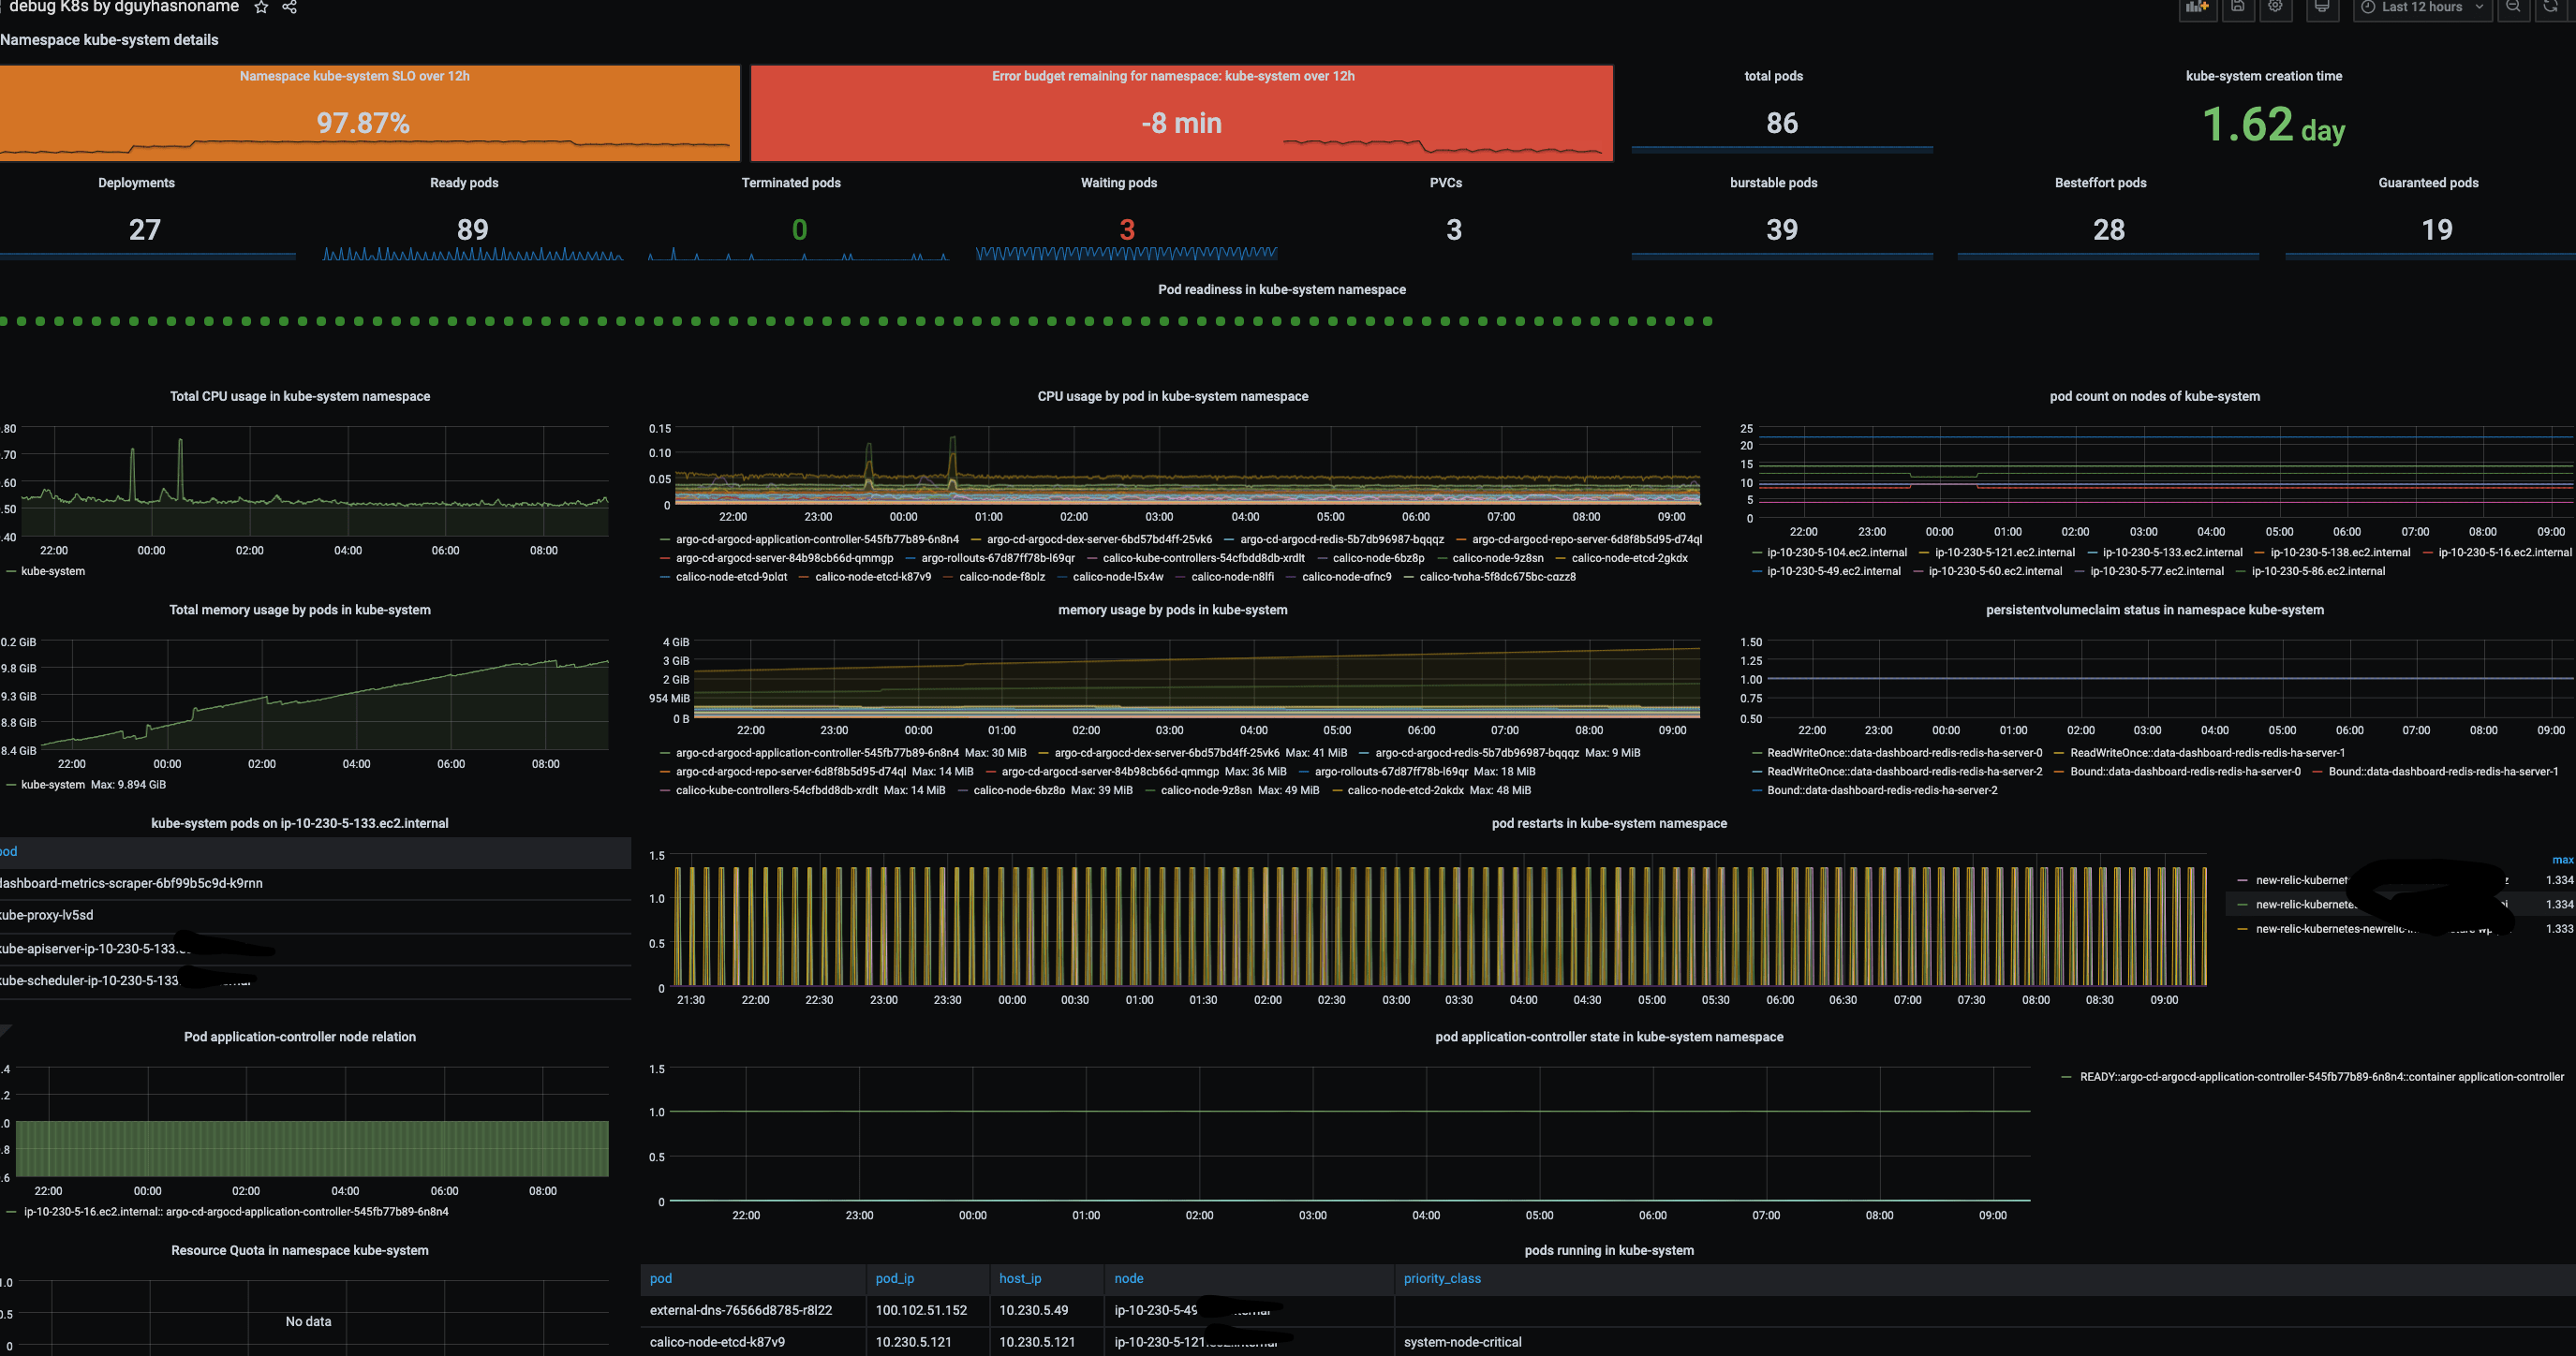
At namespace level you can find below details:
- pod readiness
- ready/waiting/terminated pod count
- No. of deployments in namespace
- Pod-node relation over period of time
- node wise pod count in the namespace
- pod restarts in namespace
- pod state over a period of time
- memory/cpu utilisation by pod
- resource quota in namespace
Data source config
Collector config:
Upload an updated version of an exported dashboard.json file from Grafana
| Revision | Description | Created | |
|---|---|---|---|
| Download |
Kubernetes
Monitor your Kubernetes deployment with prebuilt visualizations that allow you to drill down from a high-level cluster overview to pod-specific details in minutes.
Learn more