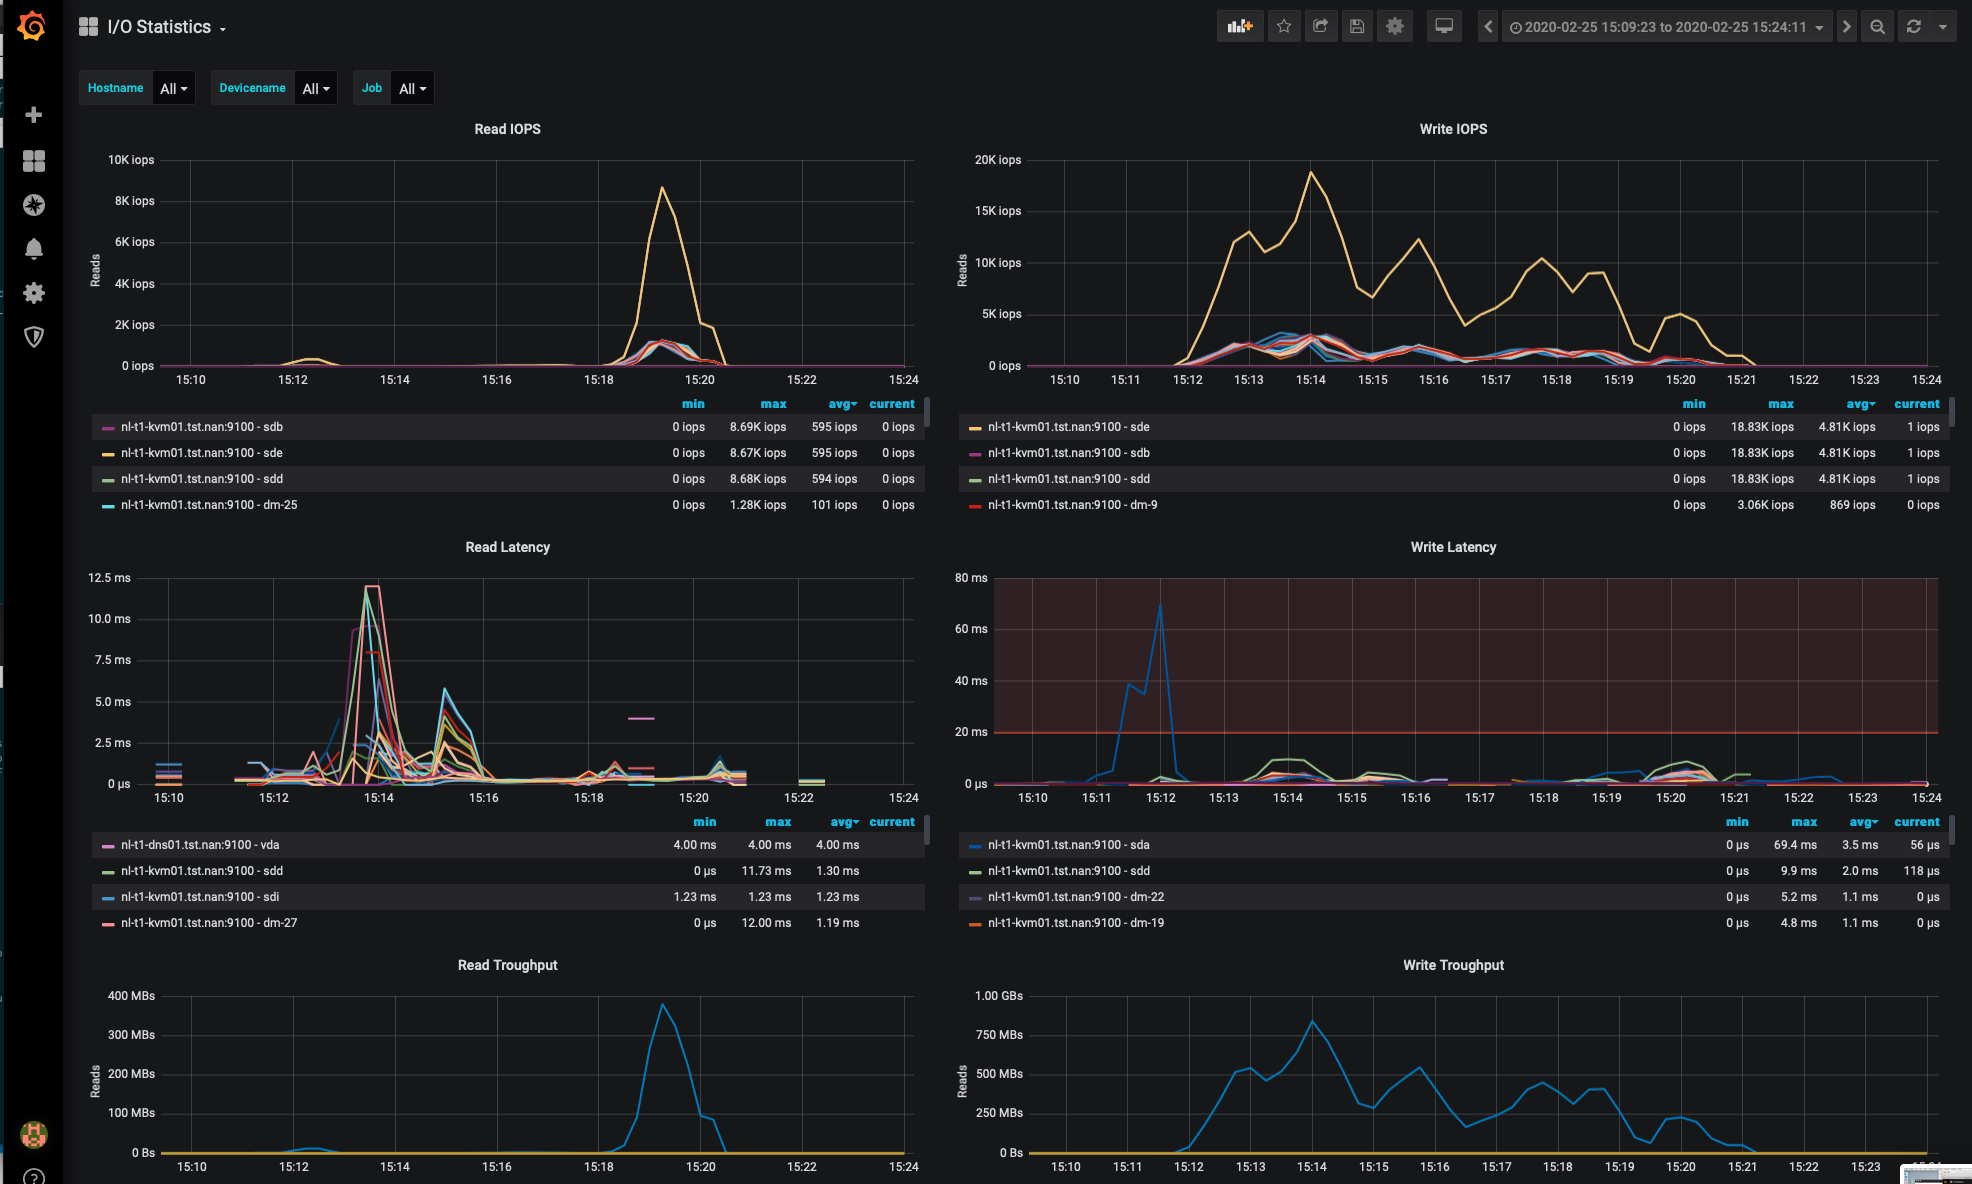
Storage I/O Statistics
This dashboards shows IOPS, I/O Latency, Average Request size and throughput. Alerts are configured for latency.
Storage performance is all about both IOPS and Latency. This dashboard IOPS and Latency performance for your various systems and devices. This board is 'special' because it shows storage latency. IOPS without Latency is meaningless.
I've checked the latency statistics with iostat and the results are identical, so I think the numbers are reliable.
It also shows the throughput and average request size for good measure.
Data source config
Collector config:
Upload an updated version of an exported dashboard.json file from Grafana
| Revision | Description | Created | |
|---|---|---|---|
| Download |

