Open Liberty - mpMetrics-2.x-4.x
Created by the Open Liberty observability team
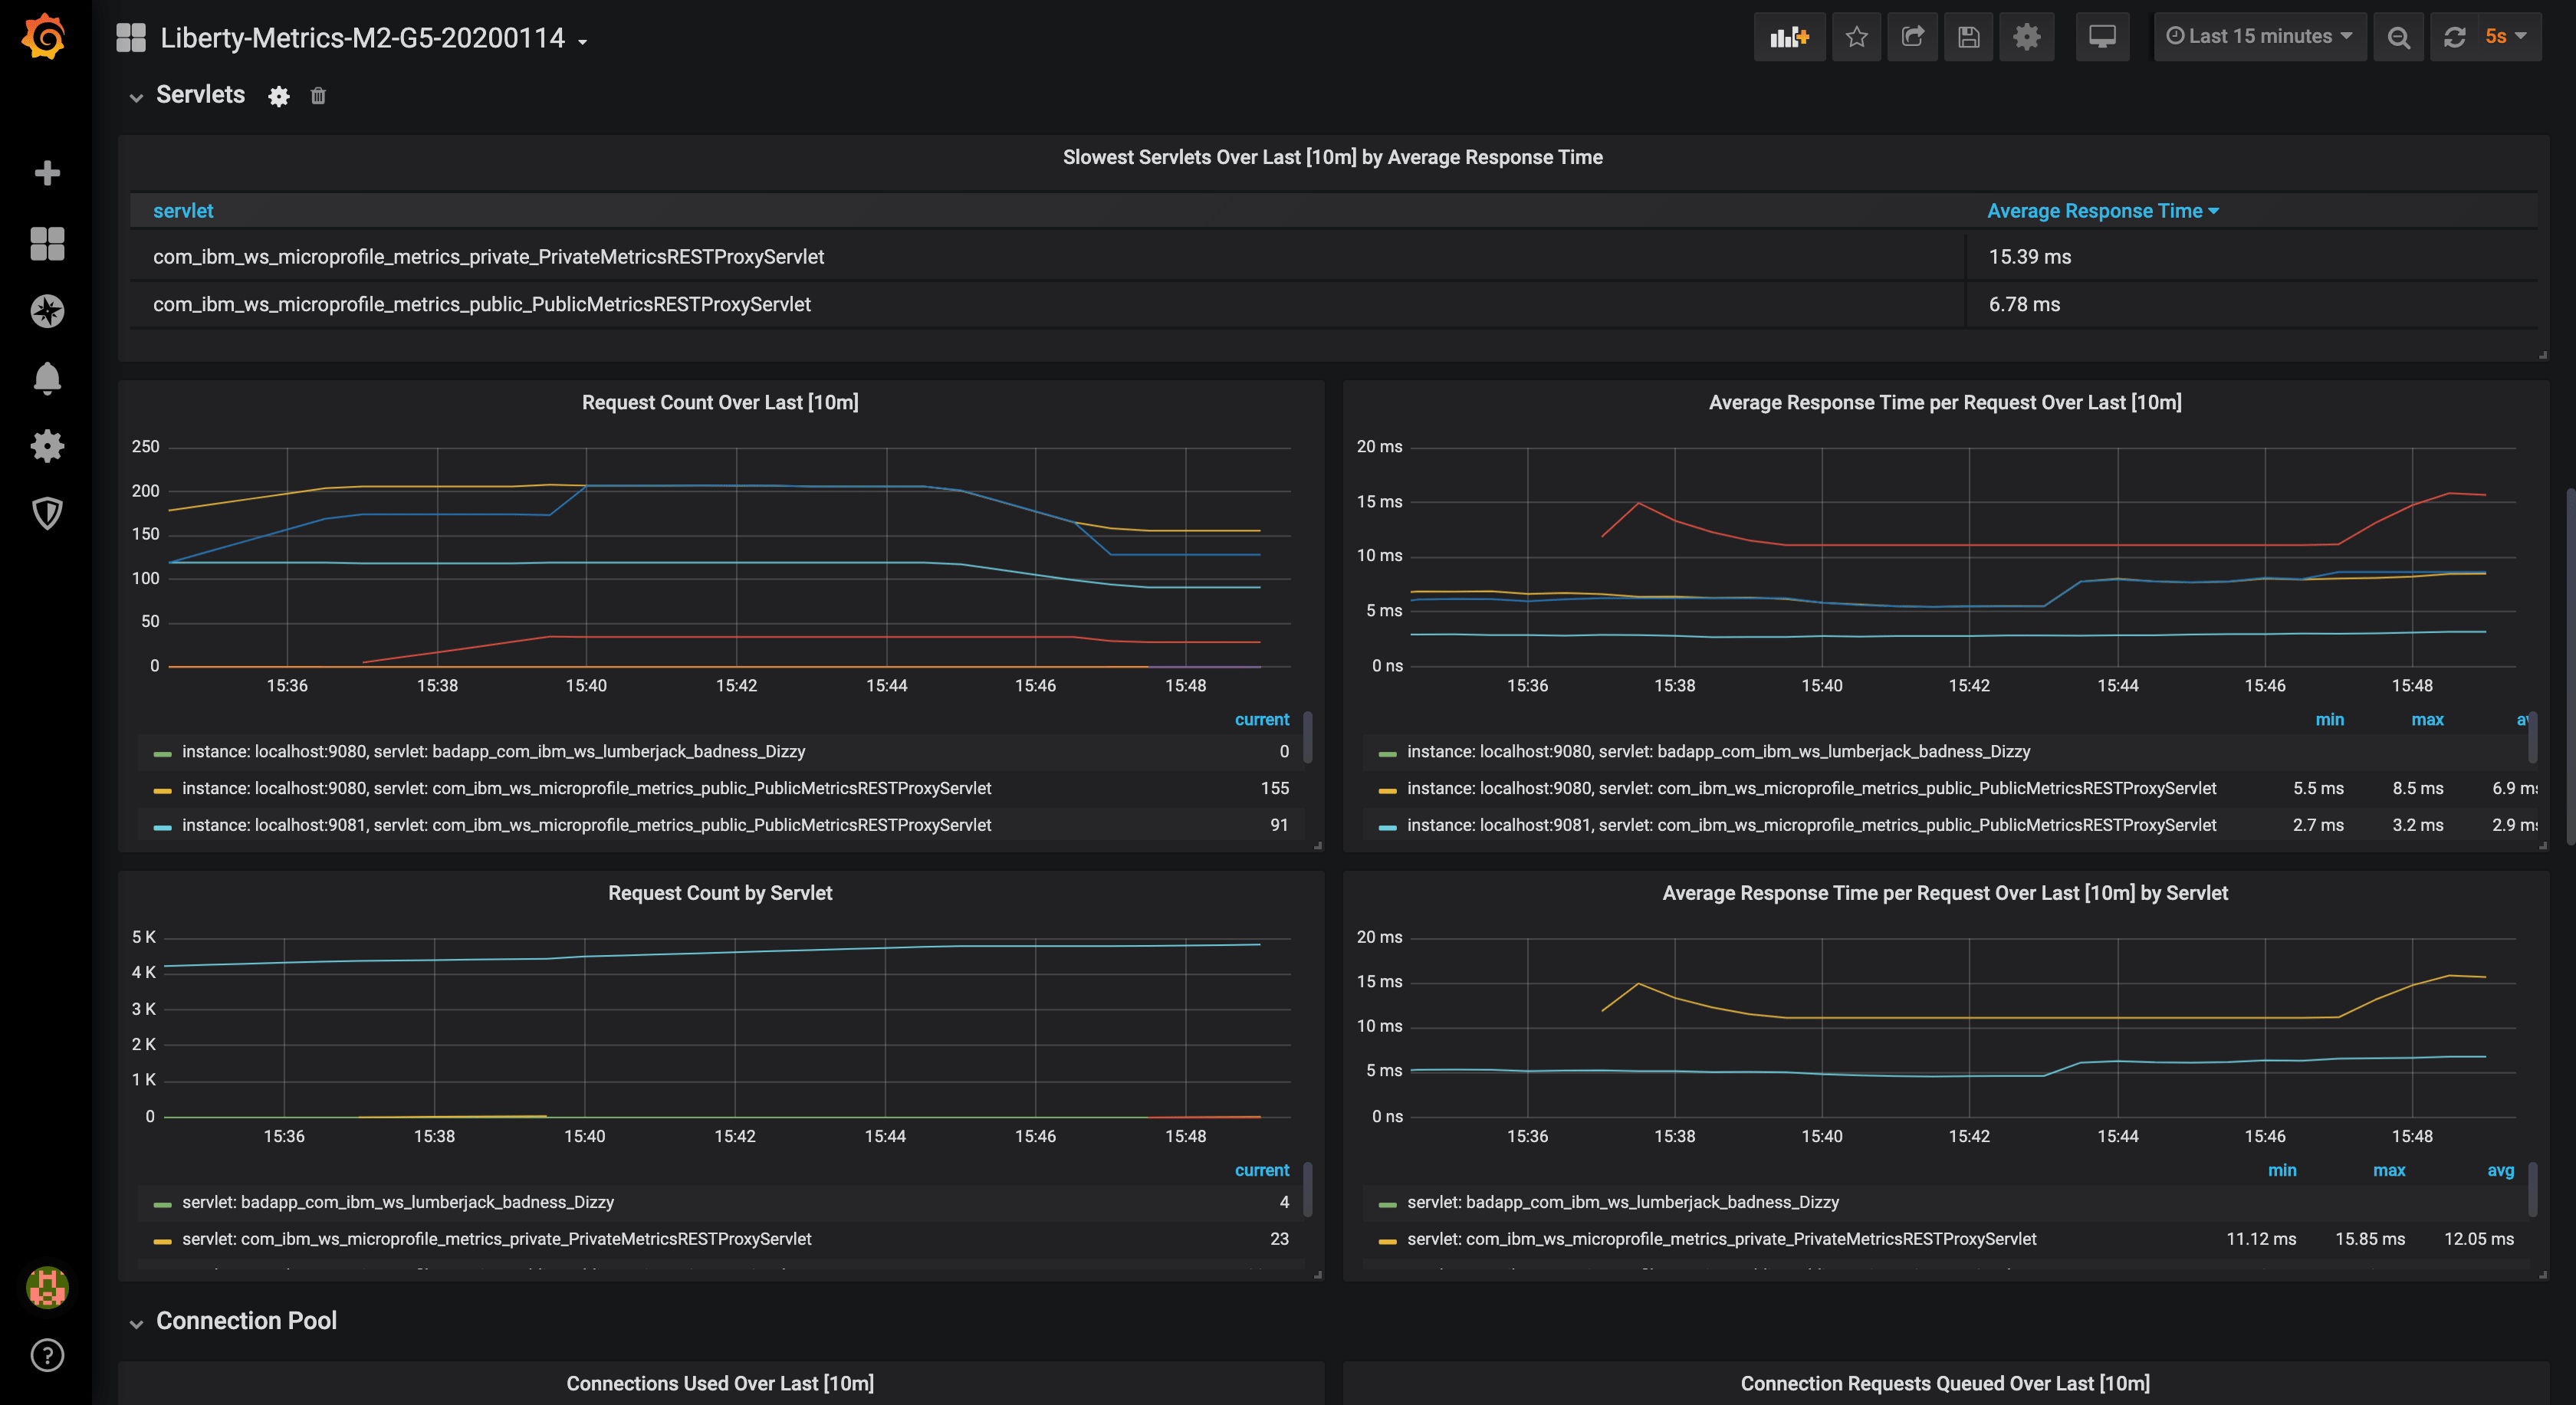
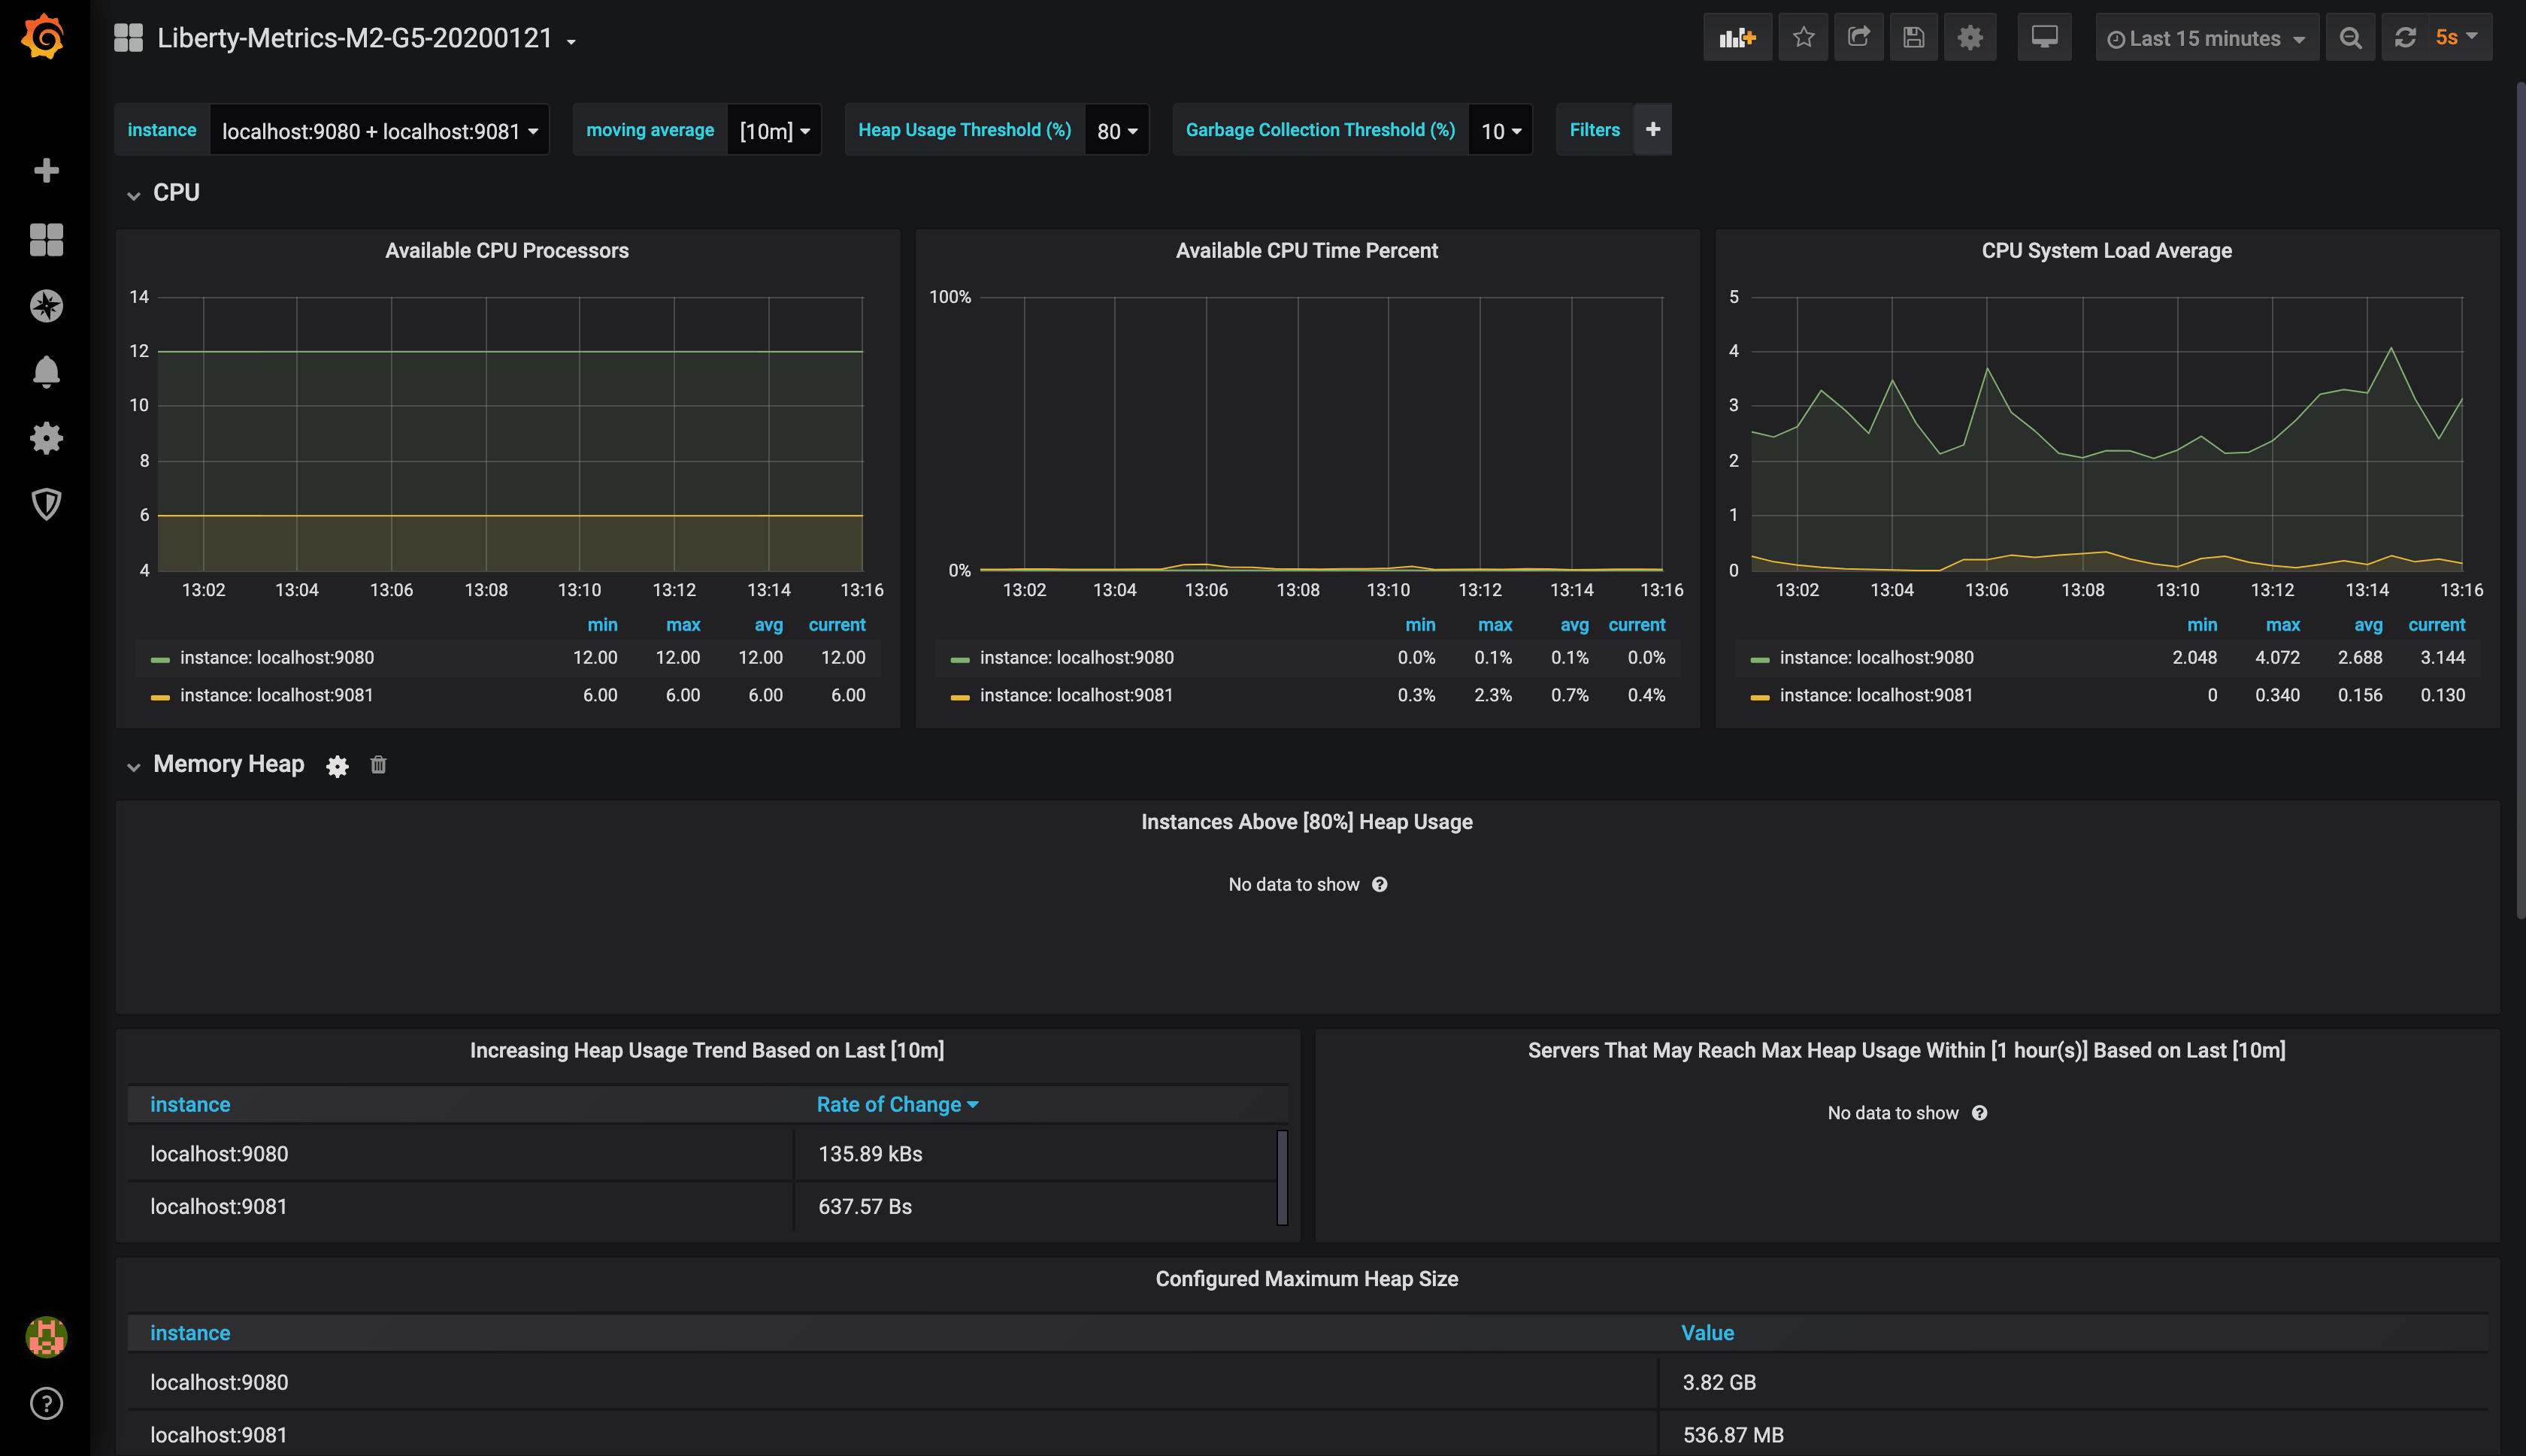
This dashboard visualizes CPU, Heap, REST, Servlet, Connection Pool, Sessions, Threadpool, GC, and other JVM metrics.
*** New in revision 5 -- we've added visualizations to show the current count of slow and hung requests generated by the requestTiming-1.0 feature.
Tested with Grafana 5.2.x, 6.0.x, 7.3.x. 8.0.x, 8.5.x
This dashboard works with Open Liberty servers running with mpMetrics-2.x, mpMetrics-3.x and mpMetrics-4.x features. For mpMetrics-5.0, use the Open Liberty - mpMetrics-5.0 dashboard
View our Open Liberty MicroProfile 3.3 blog post for detailed setup instructions.
Open Liberty
- Enable the /metrics endpoint by enabling the desired
mpMetricsfeature (e.g.mpMetrics-4.0) in theserver.xml. - For
mpMetrics-2.2and below, you must also include themonitor-1.0feature (which is automatically included when usingmpMetrics-2.3and above) - Learn about Monitoring with MicroProfile metrics
- Check out our Open Liberty Guide on Providing metrics from a Microservice
Prometheus
Configure the scrape_configs section of prometheus.yml in one of the following ways.
For metrics on an insecure endpoint:
  - job_name: 'liberty'
    scrape_interval: 5s
    static_configs:
      - targets: ['localhost:9080']
For metrics on an secure endpoint using Basic Authentication:
  - job_name: 'liberty-secure'
    scrape_interval: 5s
    static_configs:
      - targets: ['localhost:9443']
    basic_auth:
      username: "<your-username>"
      password: "<your-password>"
    tls_config:
      insecure_skip_verify: true
    scheme: "https"
Data source config
Collector config:
Upload an updated version of an exported dashboard.json file from Grafana
| Revision | Description | Created | |
|---|---|---|---|
| Download |

