OhmGraphite
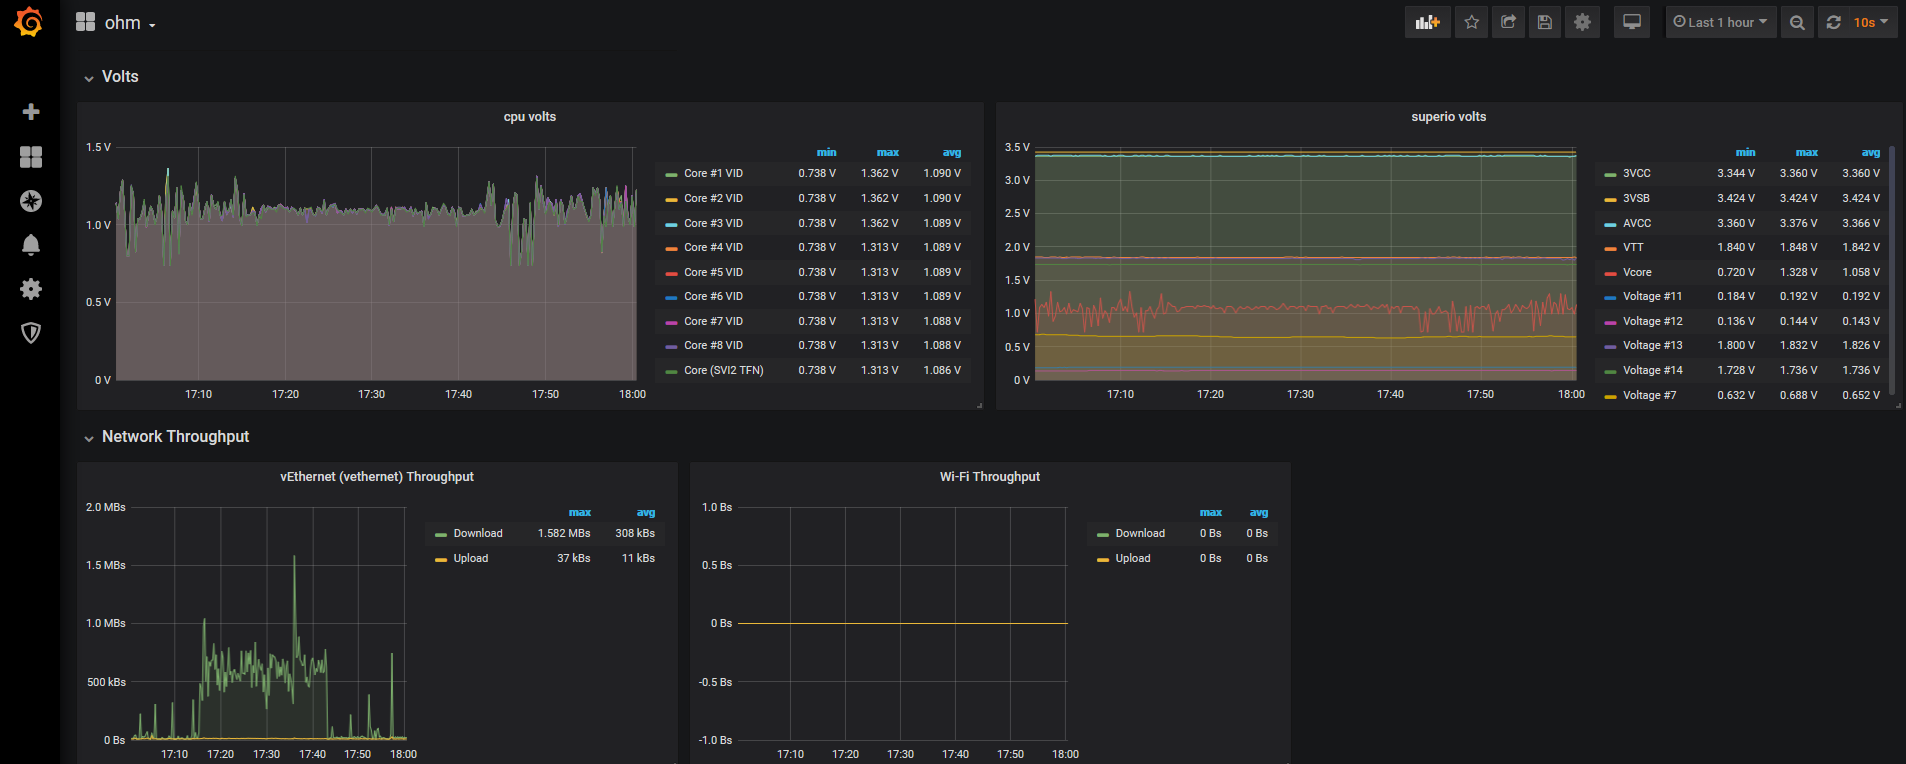
A Graphite dashboard for viewing sensor data exported by OhmGraphite
The official graphite dashboard for viewing sensor data exported by OhmGraphite.
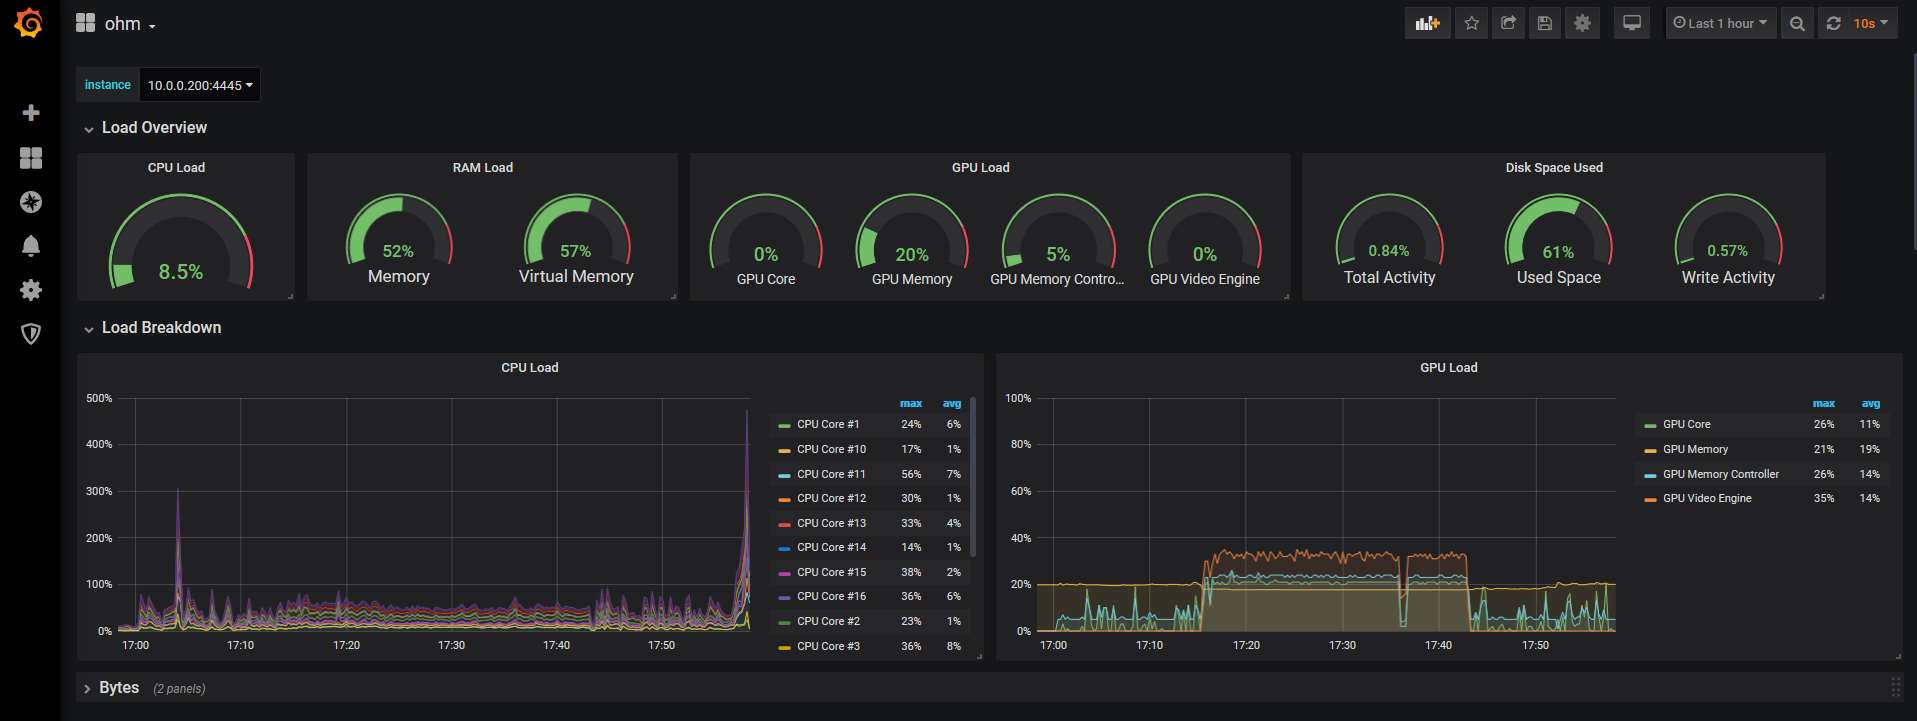
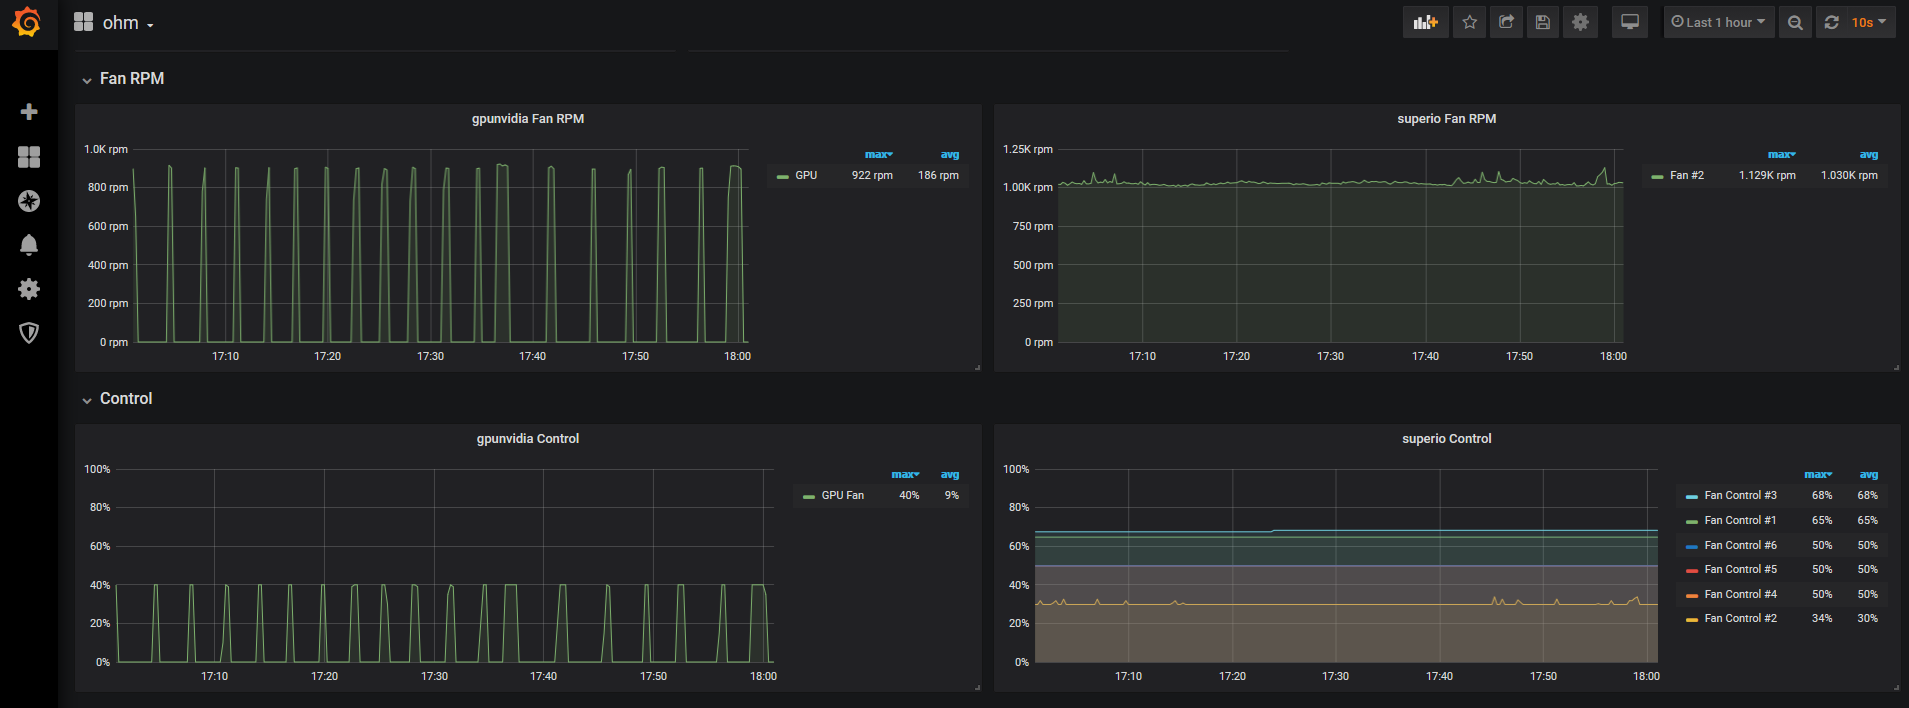
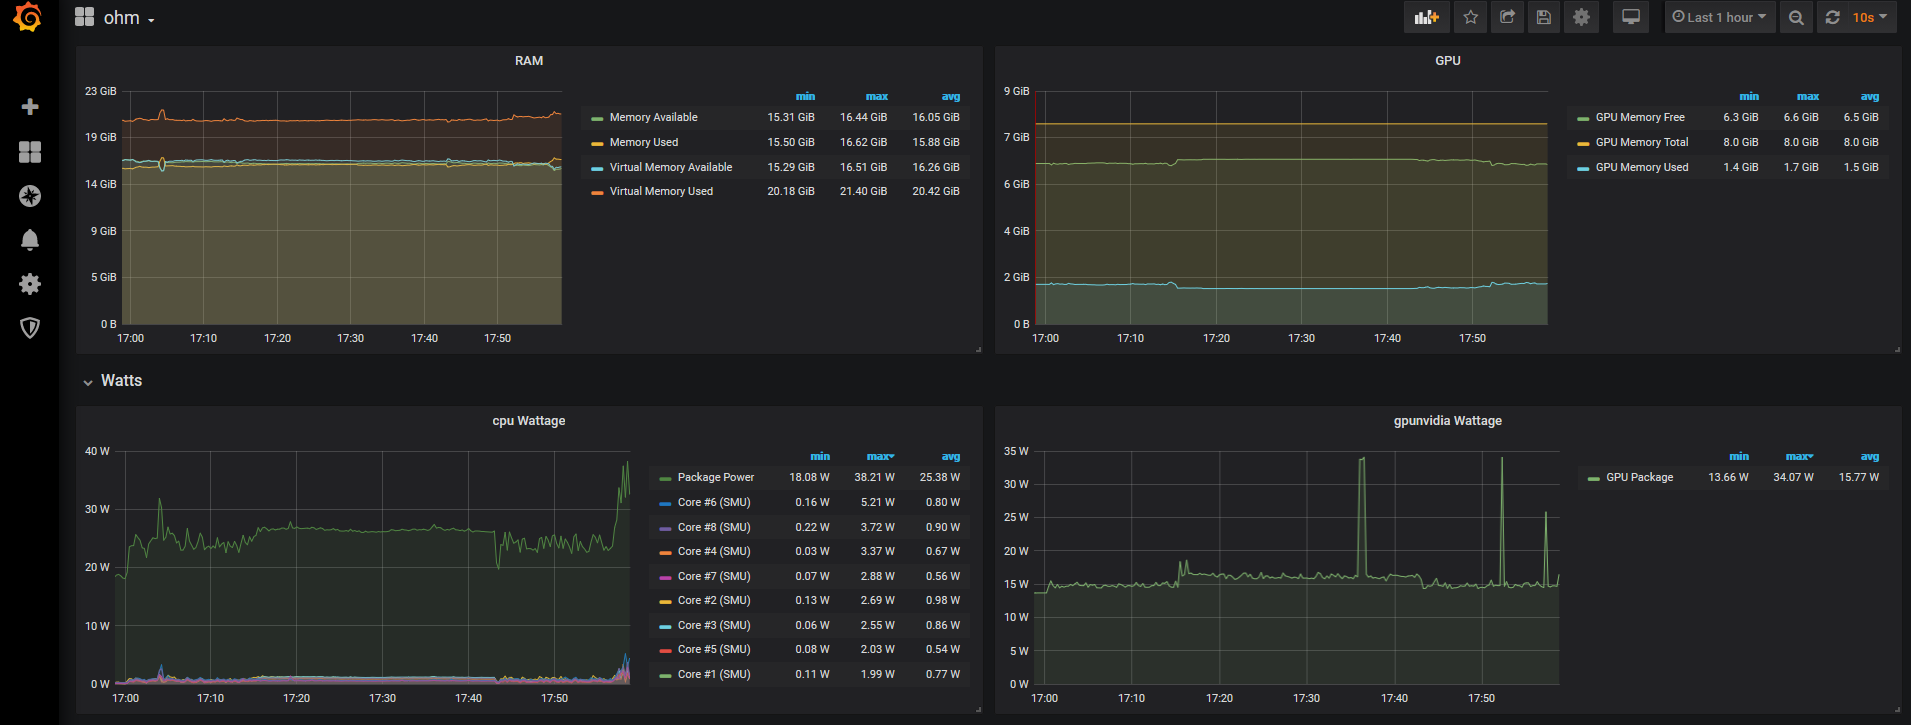
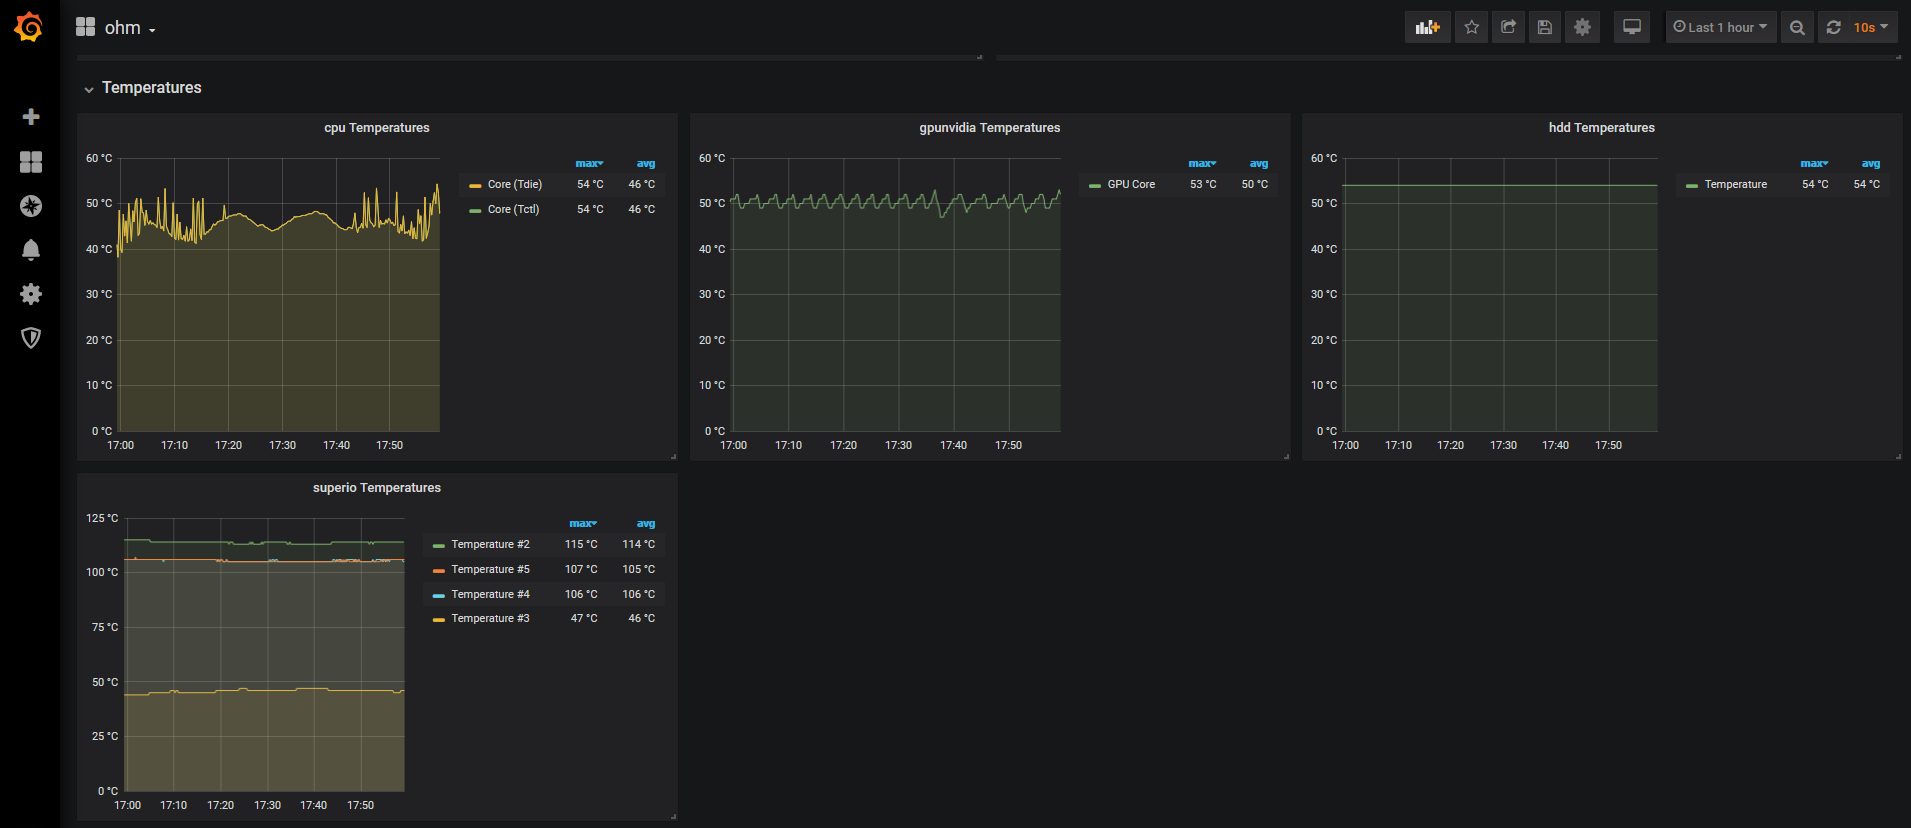
This dashboard exposes temperature, power draw, utilization, fan rpms, etc on cpu, gpu, disk, ram.
This dashboard requires the use of graphite tags, so make sure the graphite datasource has tags enabled both on the server side and in OhmGraphite. Below is the OhmGraphite config that will send tagged data to graphite
<?xml version="1.0" encoding="utf-8" ?>
<configuration>
  <appSettings>
    <add key="host" value="localhost" />
    <add key="port" value="2003" />
    <add key="interval" value="5" />
    <add key="tags" value="true" />
  </appSettings>
</configuration>
See the OhmGraphite readme for more info.
Data source config
Collector config:
Upload an updated version of an exported dashboard.json file from Grafana
| Revision | Description | Created | |
|---|---|---|---|
| Download |

