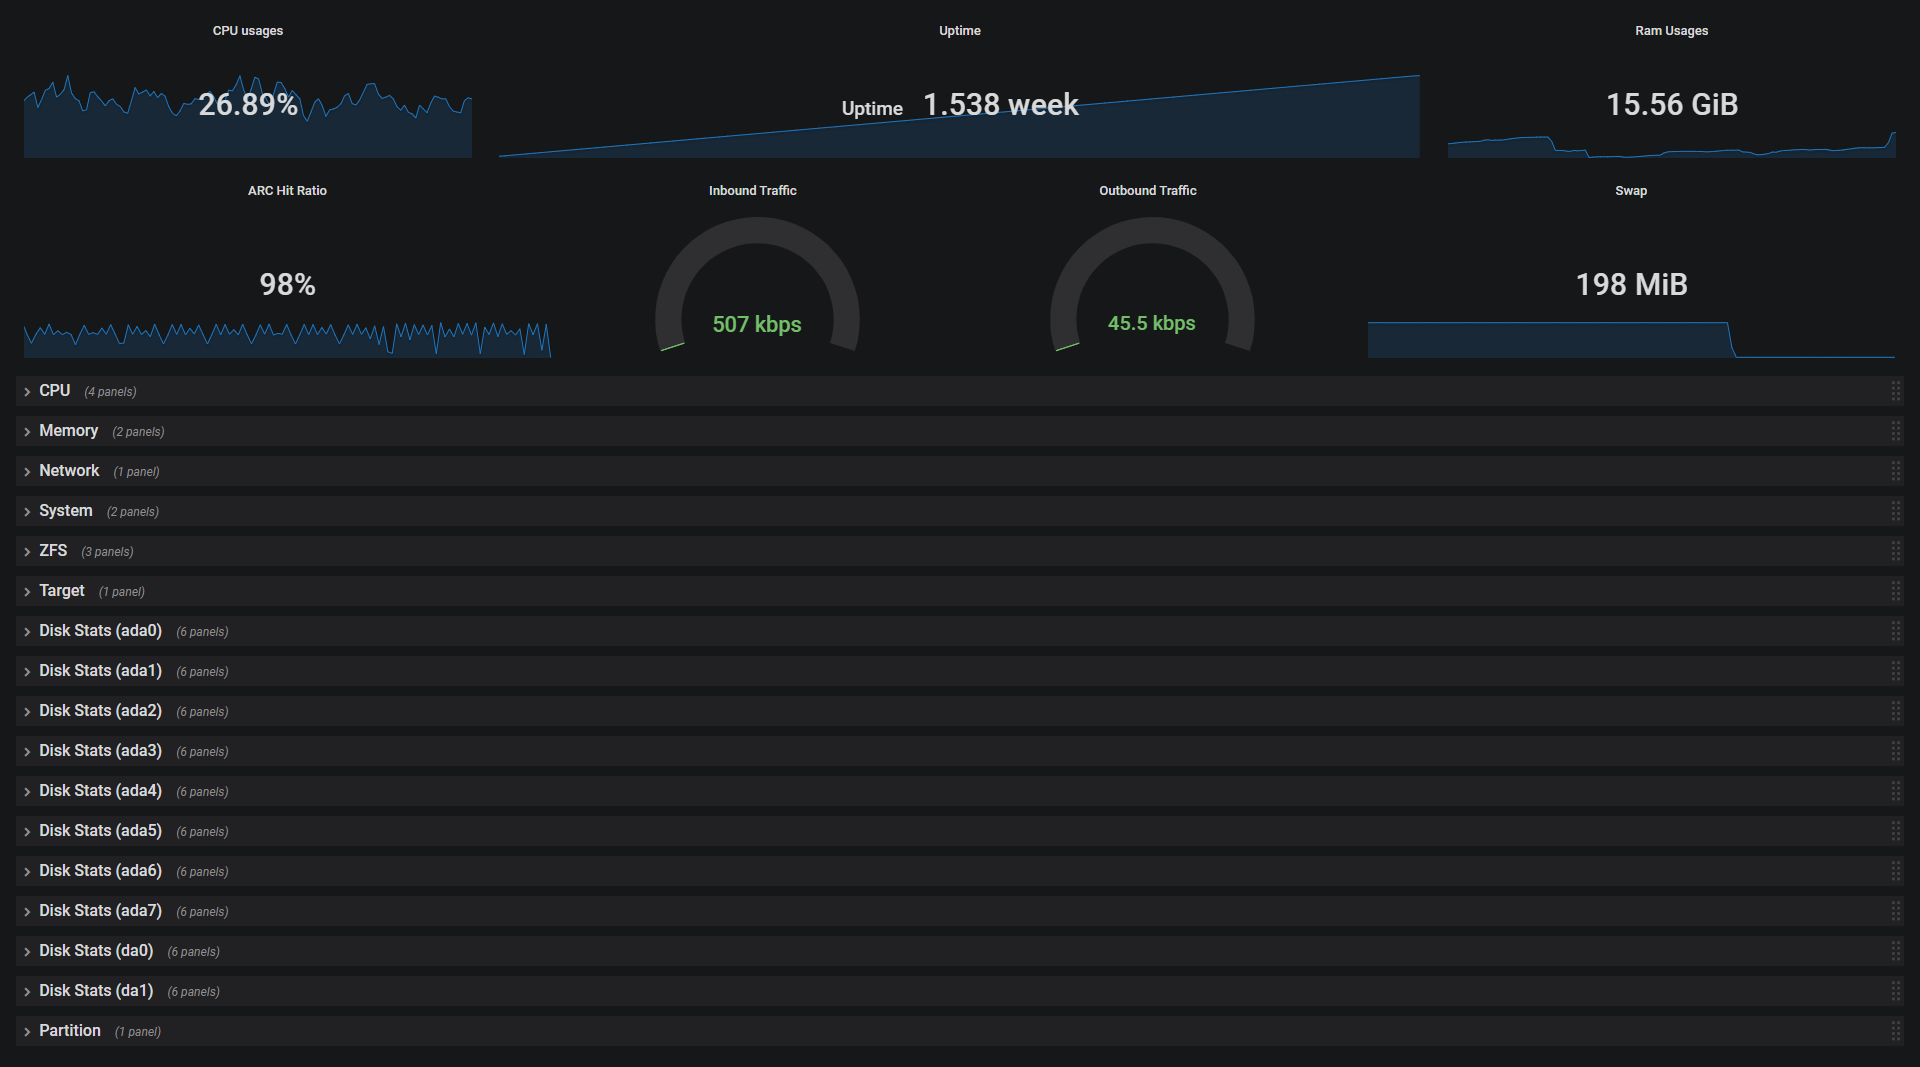
FreeNAS Status
README
The report on the FreeNAS legacy interface was re-created as Grafana. I tried to make it as similar as possible. Set 'Remote Graphite Server Hostname' of FreeNAS to the address of InfluxDB and set the graphite and rp and cq on the InfluxDB.
Known issues
- When using the'Report CPU usage in percent' option in FreeNAS, the CPU usage is not displayed properly in the Grafana dashboard.
- The max value of the Gauge graph in the main interface is hard coded. (Current value: 2147483648) Enter the maximum speed of your interface in bytes.
Change Log
- FreeNAS StatusV1e
- Added hostname variable to solve the problem that FreeNAS hostname is changed randomly.
- Removed hard-coded interface variables by adding main interface variables.
- Added datasource variable to solve'data source not found' problem.
- Fixed incorrect network unit display.
- FreeNAS StatusV1f
- Fixed a number of graphs showing incorrect units.
Data source config
Collector config:
Upload an updated version of an exported dashboard.json file from Grafana
| Revision | Description | Created | |
|---|---|---|---|
| Download |

