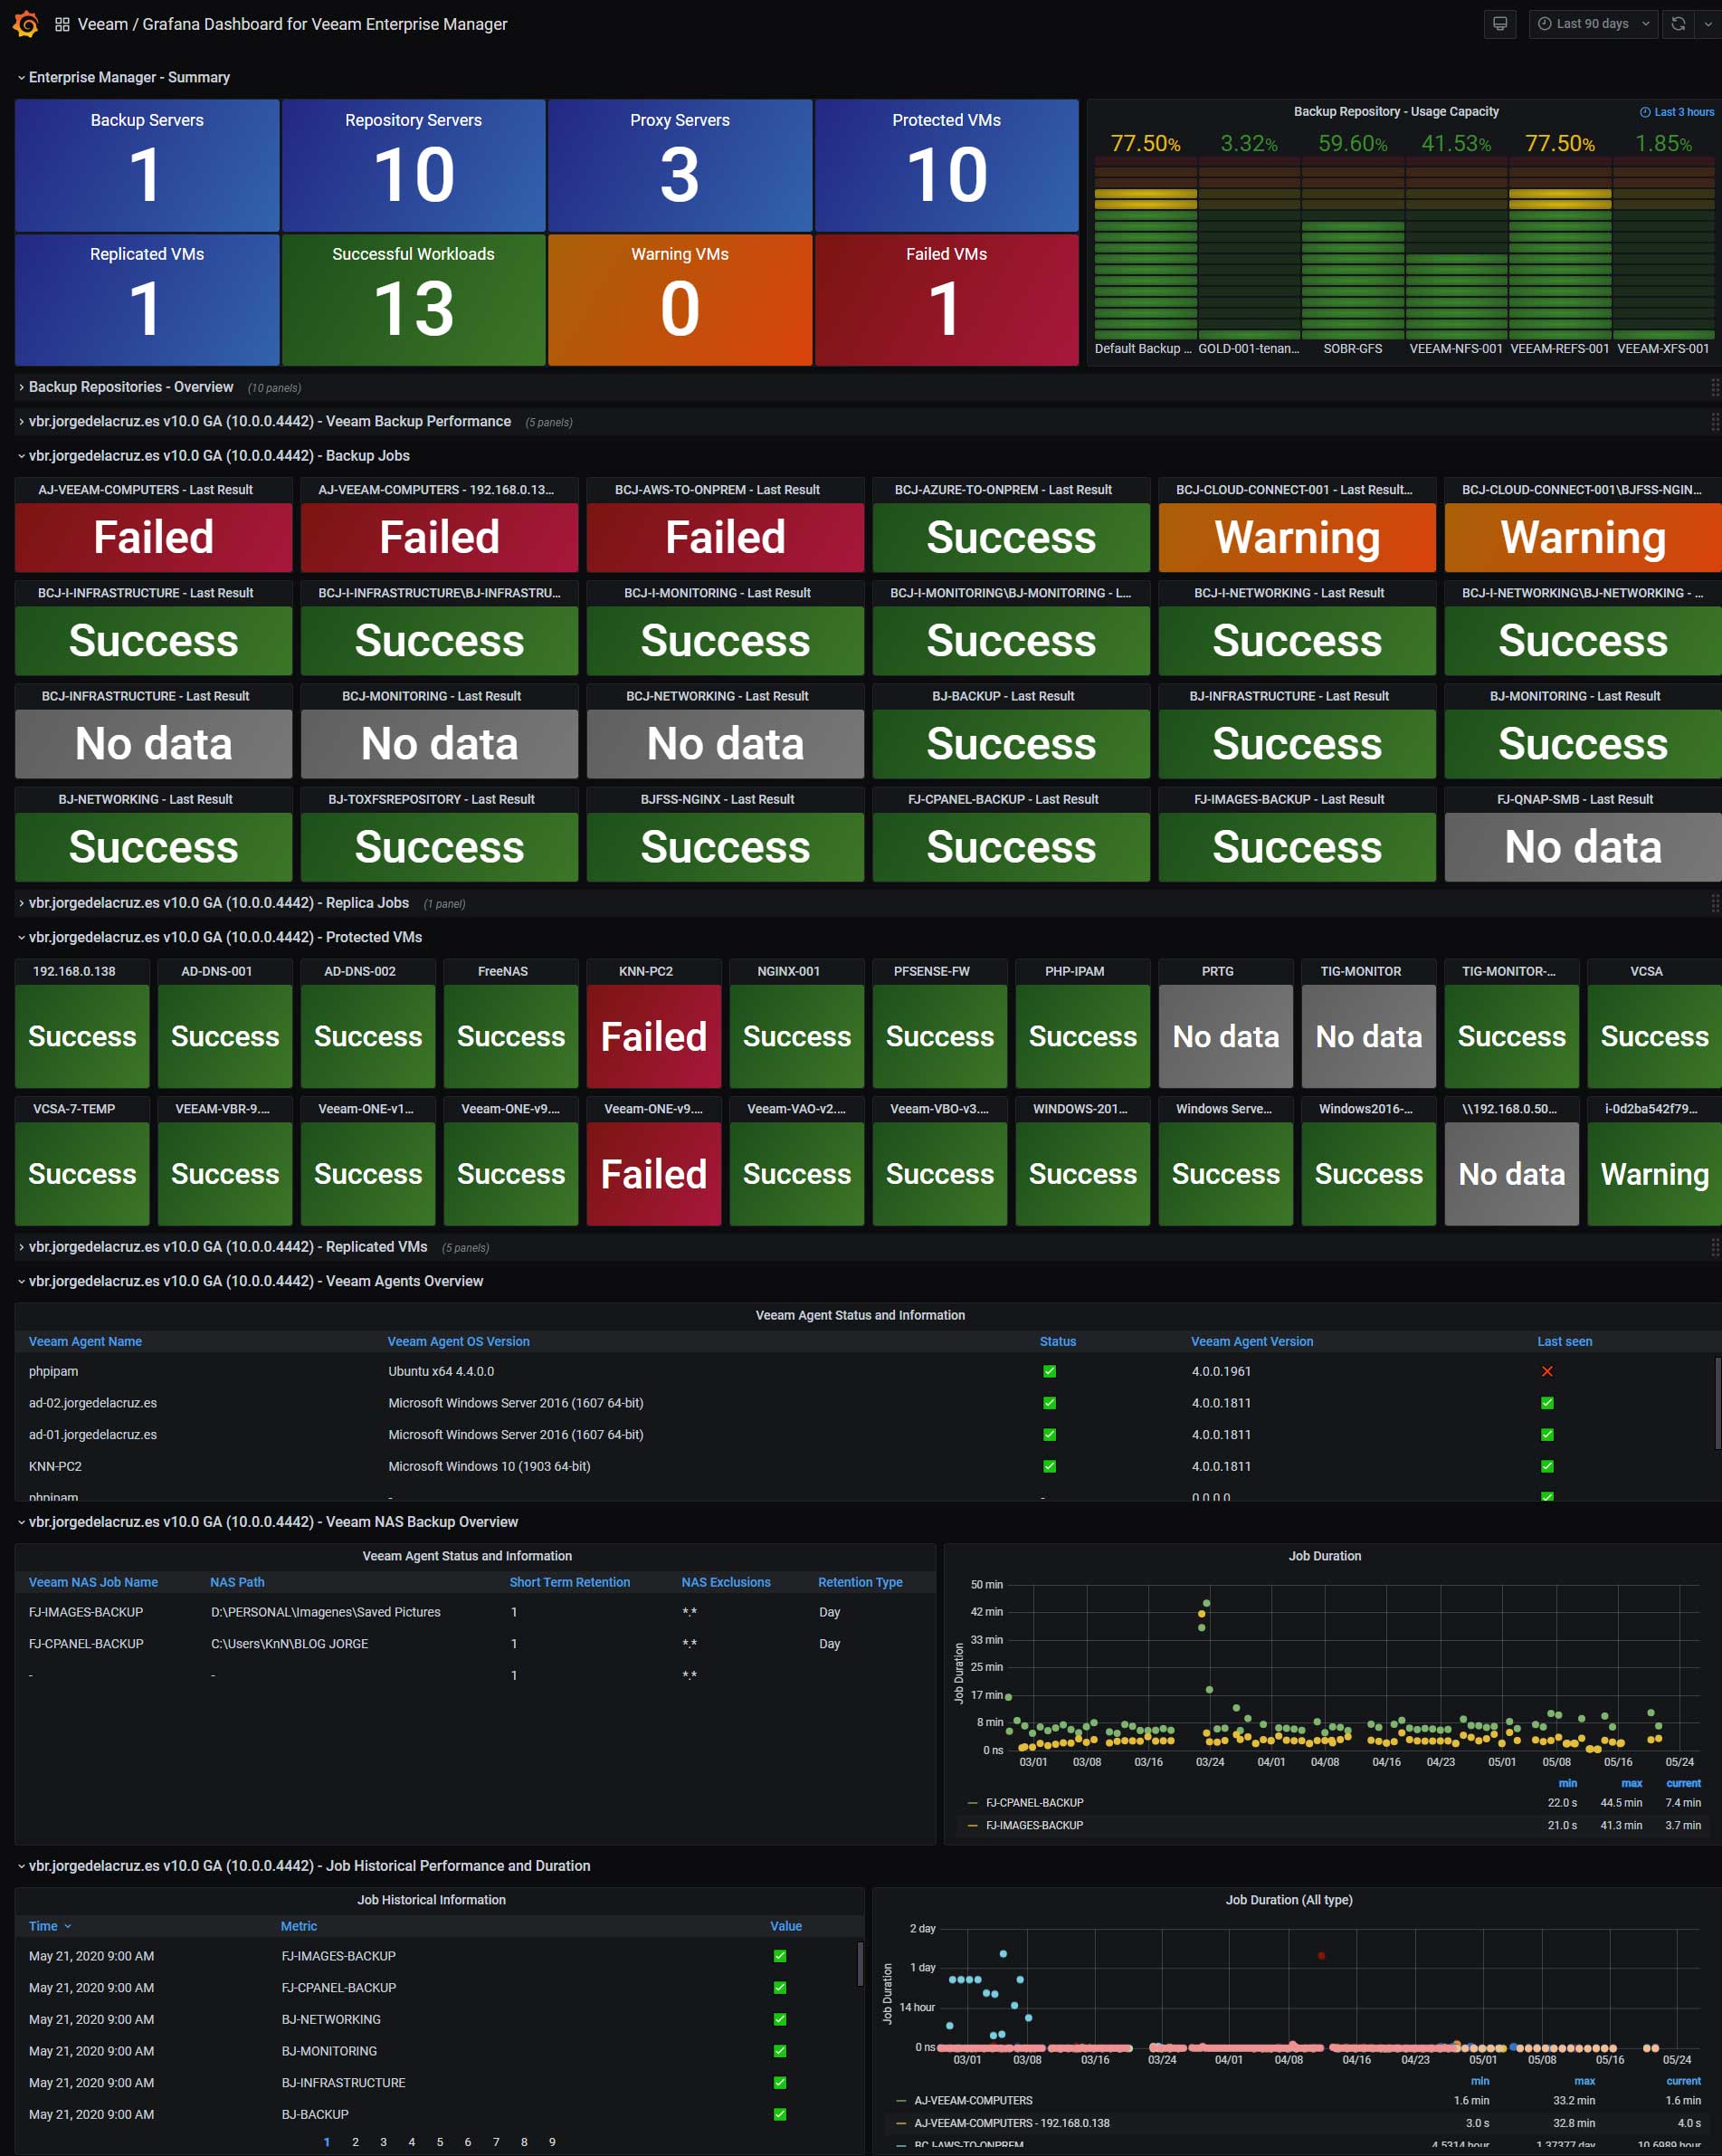
Grafana Dashboard for Veeam Enterprise Manager
Grafana Dashboard for Veeam Enterprise Manager RESTful API. (Grafana 8.x / InfluxDB v2.x)
Attention - Latest versions of this Dashboard have been built for InfluxDB v2.0 using Flux, you can easily see it under the revisions tab, grab the one you need for your InfluxDB v1.8 or v2.0
Requires Veeam Enterprise Plus or VUL licensing
Just download the latest Veeam Enterprise Manager script version from GitHub https://raw.githubusercontent.com/jorgedlcruz/veeam-enterprise_manager-grafana/master/veeam_enterprisemanager.sh and change the Configuration section within your details:
##
# Configurations
##
# Endpoint URL for InfluxDB
veeamInfluxDBURL="http://YOURINFLUXSERVERIP" #Your InfluxDB Server, http://FQDN or https://FQDN if using SSL
veeamInfluxDBPort="8086" #Default Port
veeamInfluxDB="telegraf" #Default Database
veeamInfluxDBUser="USER" #User for Database
veeamInfluxDBPassword="PASSWORD" #Password for Database
Endpoint URL for login action
veeamUsername="YOUREMUSER" #Your username, if using domain based account, please add it like user@domain.com (if you use domain\account it is not going to work!)
veeamPassword="YOUREMPASSWORD"
veeamAuth=$(echo -ne "$veeamUsername:$veeamPassword" | base64);
veeamRestServer="YOUREMSERVERIP"
veeamRestPort="9398" #Default Port
Once the changes are done, make the script executable with chmod:
chmod +x veeam_enterprisemanager.sh
The output of the command should be something like the next, without errors:
HTTP/1.1 204 No Content
Content-Type: application/json
Request-Id: 53ee7045-30e1-11ea-8bf5-000000000000
X-Influxdb-Build: OSS
X-Influxdb-Version: 1.6.3
X-Request-Id: 53ee7045-30e1-11ea-8bf5-000000000000
Date: Tue, 07 Jan 2020 00:04:52 GMT
If so, please now add this script to your crontab, like for example every 30 minutes:
*/30 * * * * * /home/oper/veeam_enterprisemanager.sh >> /var/log/veeam_enterprisemanager.log 2>&1
Check now that you can see all the new data on your Chronograf:

Then download or import this Dashboard to your Grafana, and you should see something similar to the next:

Data source config
Collector config:
Upload an updated version of an exported dashboard.json file from Grafana
| Revision | Description | Created | |
|---|---|---|---|
| Download |
cert-manager
Easily monitor cert-manager, the certificate controller for Kubernetes and OpenShift, with Grafana Cloud's out-of-the-box monitoring solution.
Learn more
