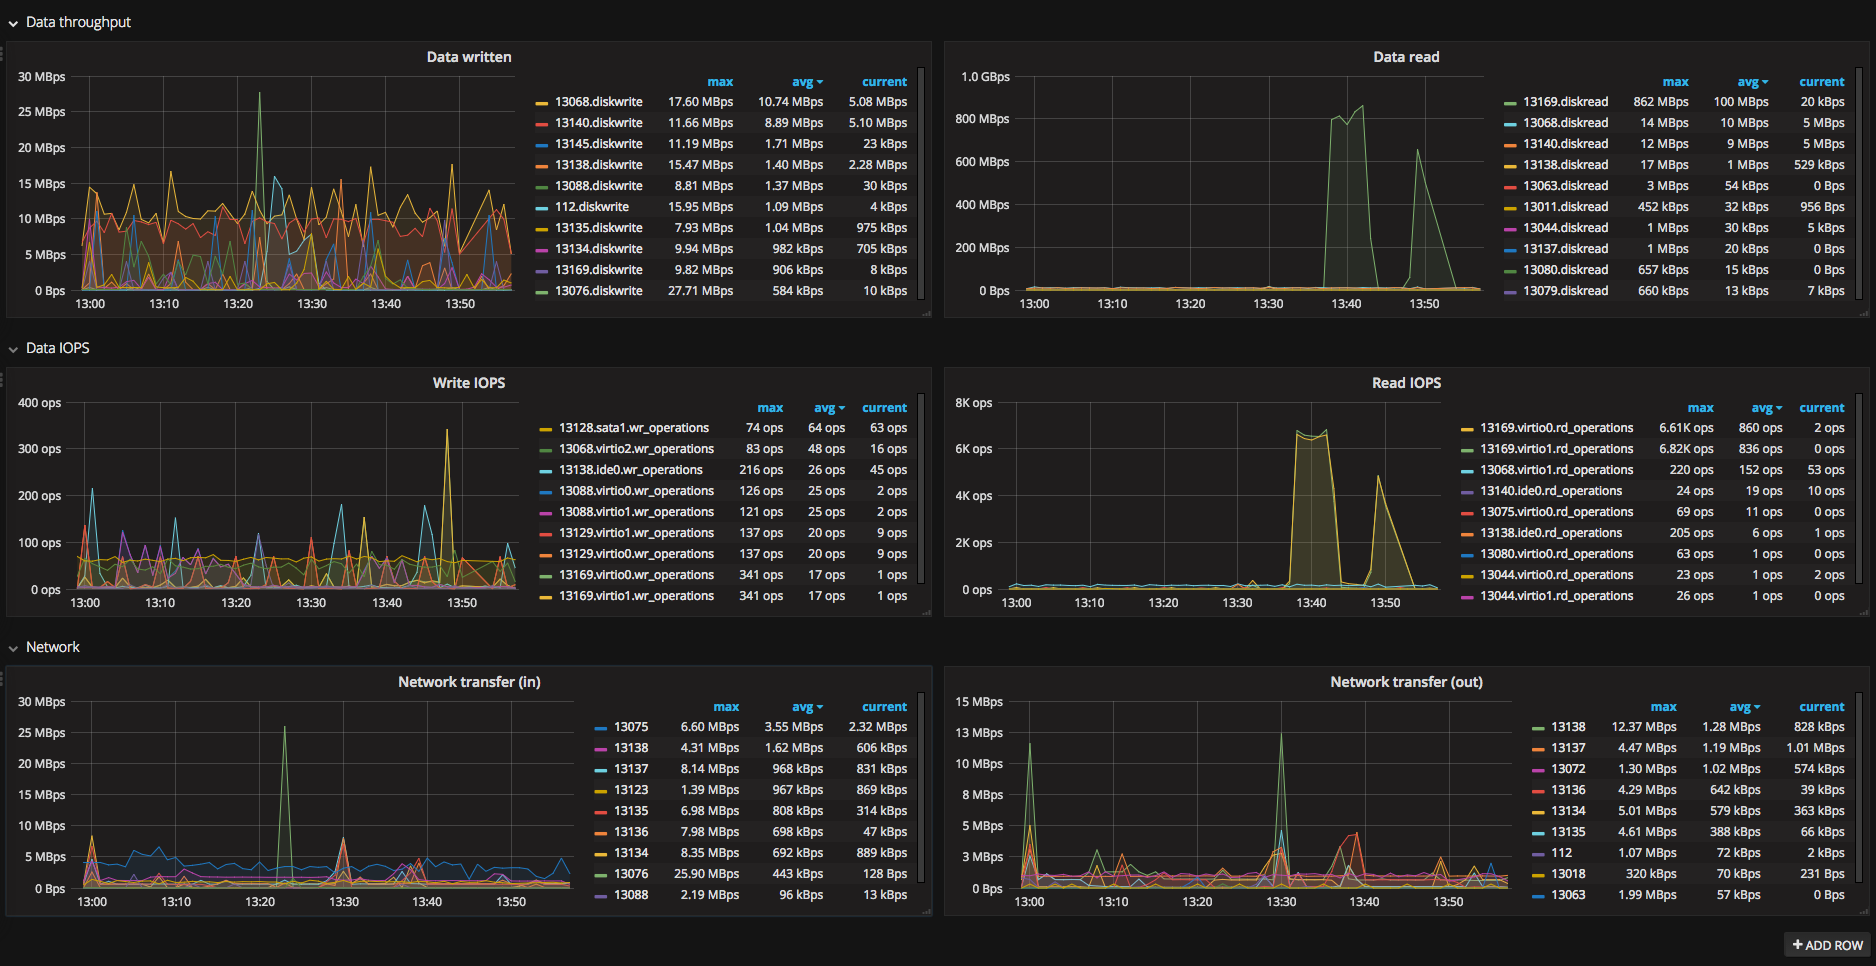
Proxmox - top 10 hogs
This is dashboard for finding which VM in your proxmox cluster eats most IOPS/Data/Network.
Usage
If you already have proxmox metric collection enabled, just import dashboard.
Configuration
Requires Proxmox VE >= 4.0!
Install graphite (i use go-carbon with carbonapi).
Carbon should listen on UDP port, 2003 by default.
For schema file, use something like
[carbon]
pattern = ^carbon\.
retentions = 60:90d
[proxmox]
pattern = ^proxmox.
retentions = 60:30d
[default_1min_for_1day]
pattern = .*
retentions = 60s:1d
Next, go to /etc/pve/status.cfg on your proxmox cluster machine (create this file if it doesn't exist) with contents:
graphite:
   server your_carbon_server
   port 2003
   path proxmox
Restart pvestatd (might not be needed). Metrics should start arriving to carbon.
Import dashboard and you're ready to go.
Data source config
Collector type:
Collector plugins:
Collector config:
Revisions
Upload an updated version of an exported dashboard.json file from Grafana
| Revision | Description | Created | |
|---|---|---|---|
| Download |