KubeCost
fixed images
Dashboard made using https://github.com/kubecost/cost-model open source metrics.
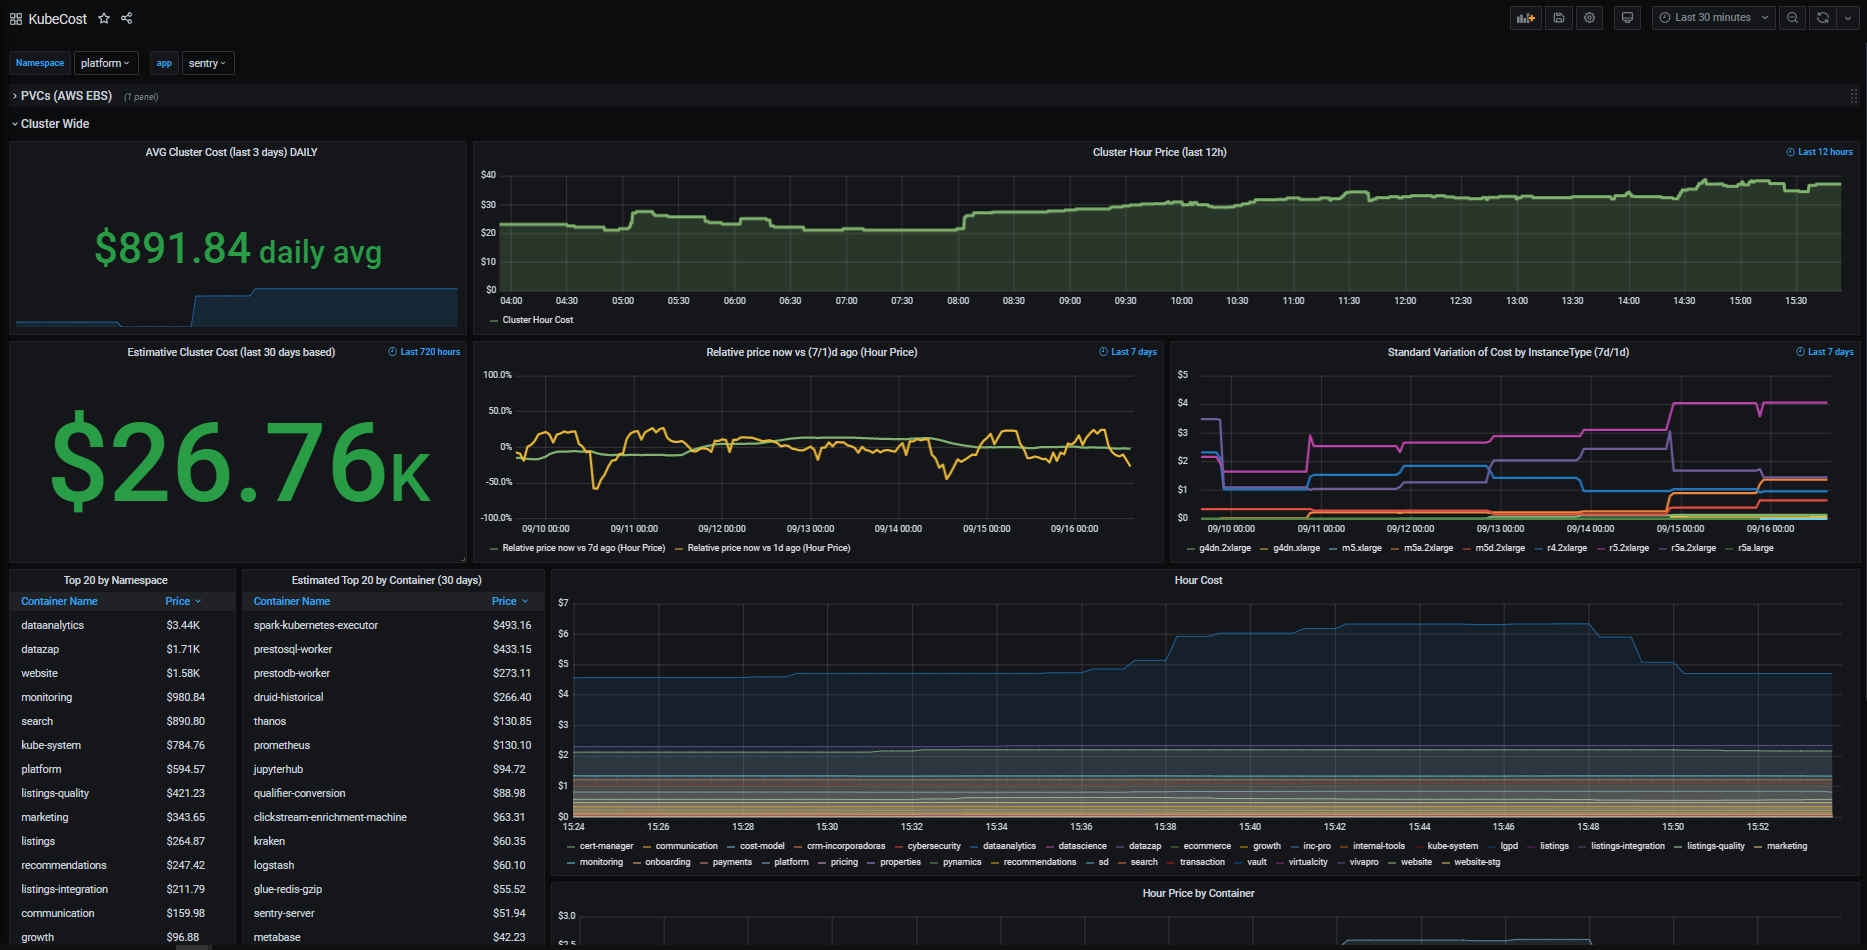
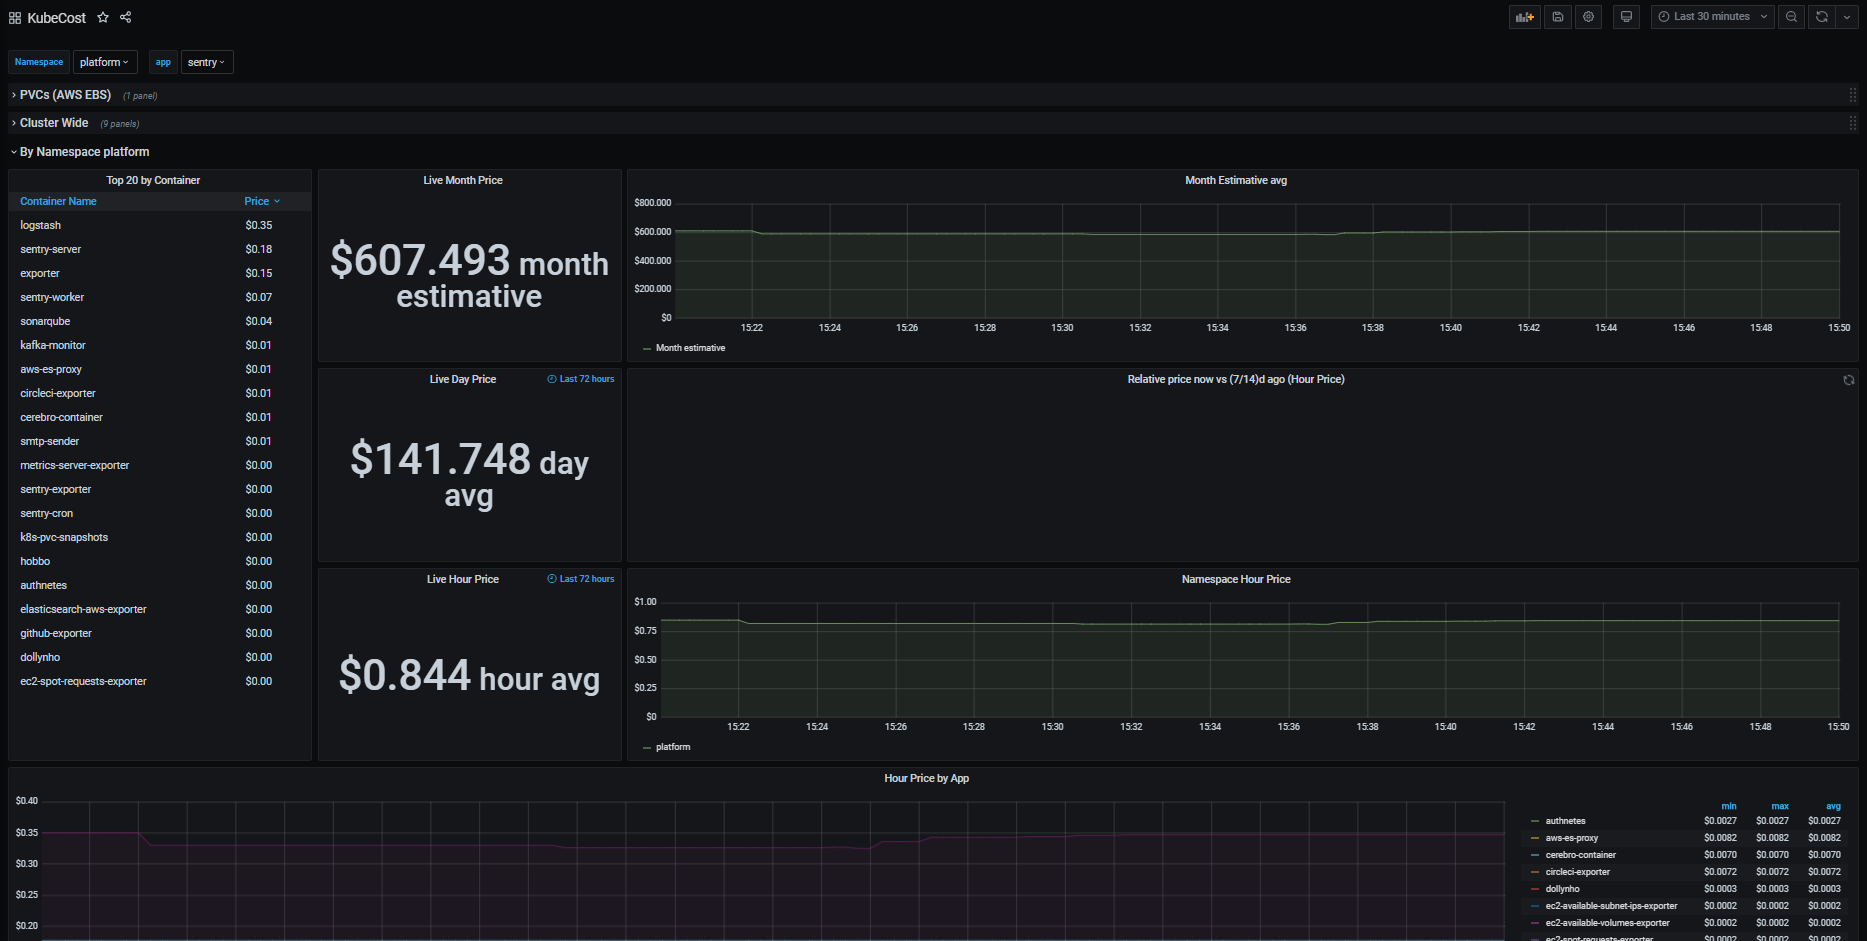
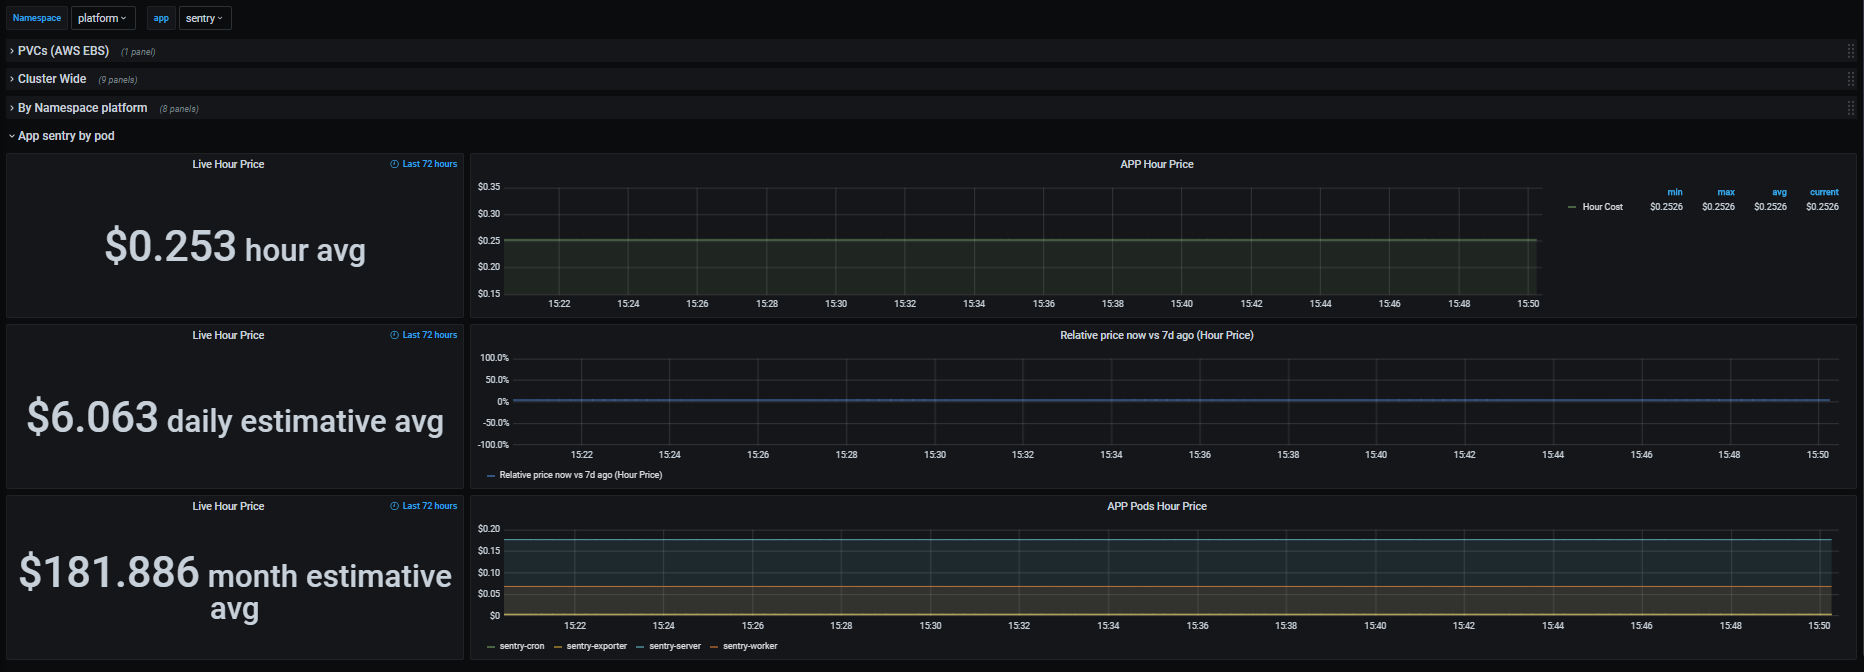
This dashboard gives your Kubernetes cluster costs:
- Cluster Wide (Live and Estimative)
- Relative price of spot instances
- Namespace (Live and Estimative)
- Price variation between days and weeks
- APP (Live and average)
- Price comparisson with 7 days ago
- PVC Costs
** CONFIGURING YOUR DEPLOYMENTS/STATEFULSETS/SERVICES/CRONJOBS/DS with a label app and product is essential to use all features of the dashboard**
To use the dashboard just add the following scrap rule to your Prometheus and import the dashboard to Grafana.
- job_name: kubecost
  honor_labels: true
  scrape_interval: 1m
  scrape_timeout: 10s
  metrics_path: /metrics
  scheme: http
  static_configs:
  - targets:
    - < address of cost-model service> # example: <service-name>.<namespace>:<port>
All metrics were made using the following docs: https://github.com/kubecost/cost-model/blob/master/PROMETHEUS.md
Problems or suggestions, reach me at https://github.com/gkope
Data source config
Collector config:
Upload an updated version of an exported dashboard.json file from Grafana
| Revision | Description | Created | |
|---|---|---|---|
| Download |


