
SLO Dashboard
Tracks service's SLO and error budget consumption.
The dashboard is based on the following example: https://github.com/google/prometheus-slo-burn-example
The dashboard assumes that there is a probe, which probes service's availability and exports the data using metrics, which are then used by this dashboard. There are supposed to be two metrics exposed, which can have any name (it is configurable in the parameters):
- requests_error_count - the number of requests to the service returned an error;
- requests_total_count - the total number of requests to the service.
Settings for color switching are needed to be adjusted:
After
error_budgetparameter is adjusted for the required level, it is necessary to adjust the thresholds for color switching atError Budget Leftsinglestat panel. It can be done viaVizualizationtab.After
service_slo_targetparameter is adjusted for the required level, it is necessary to adjust the thresholds for color switching atCurrent SLOsinglestat panel. It can be done viaVizualizationtab.
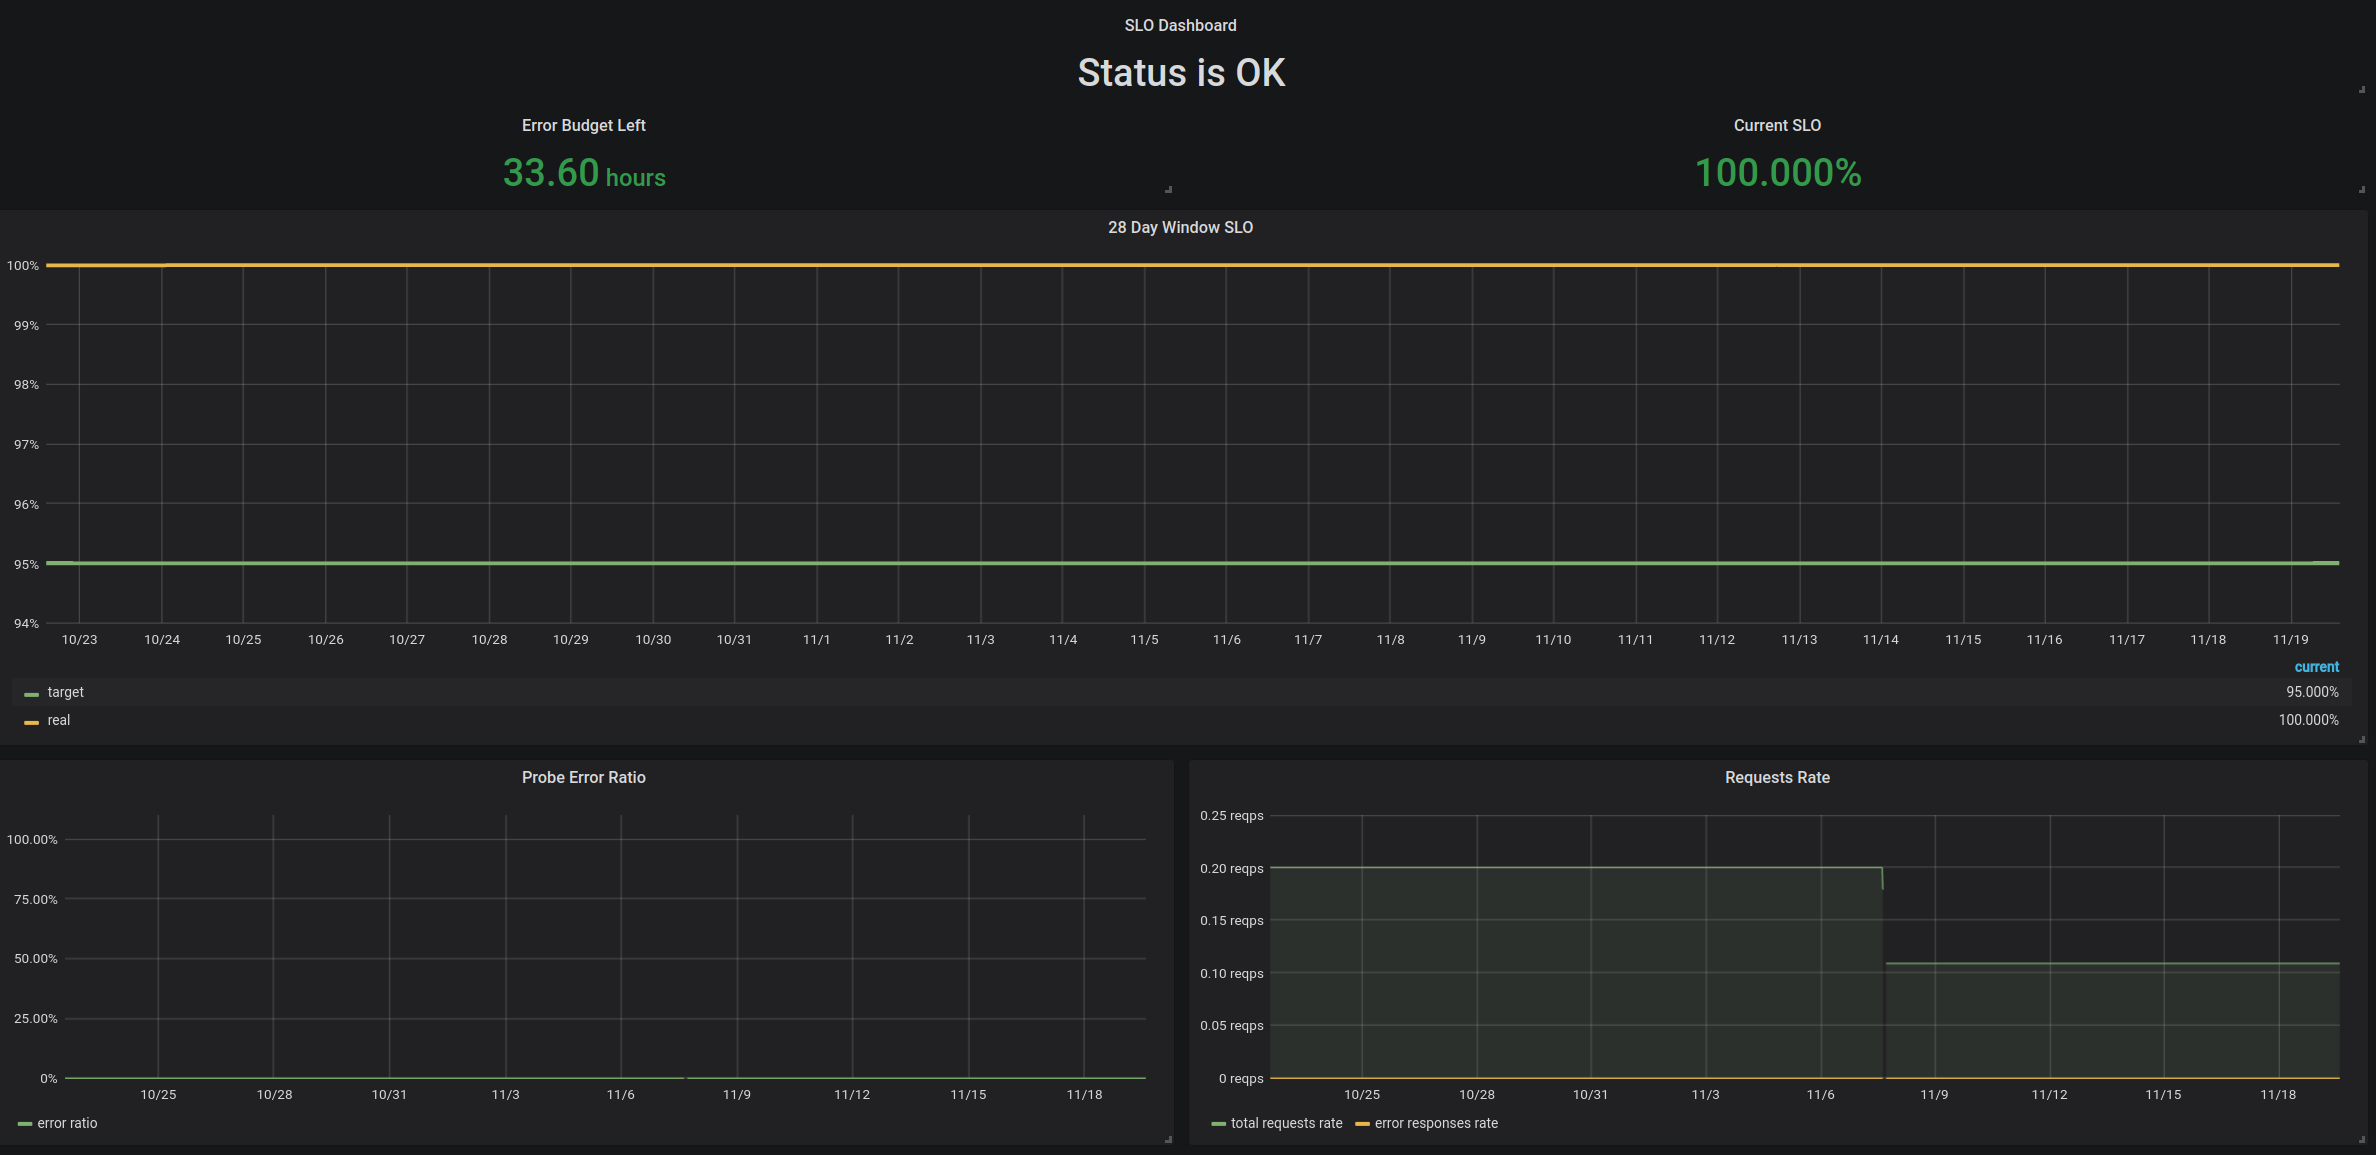
The highest panel has two states:
- Status is OK - there are no alerts firing for the last 5 minutes.
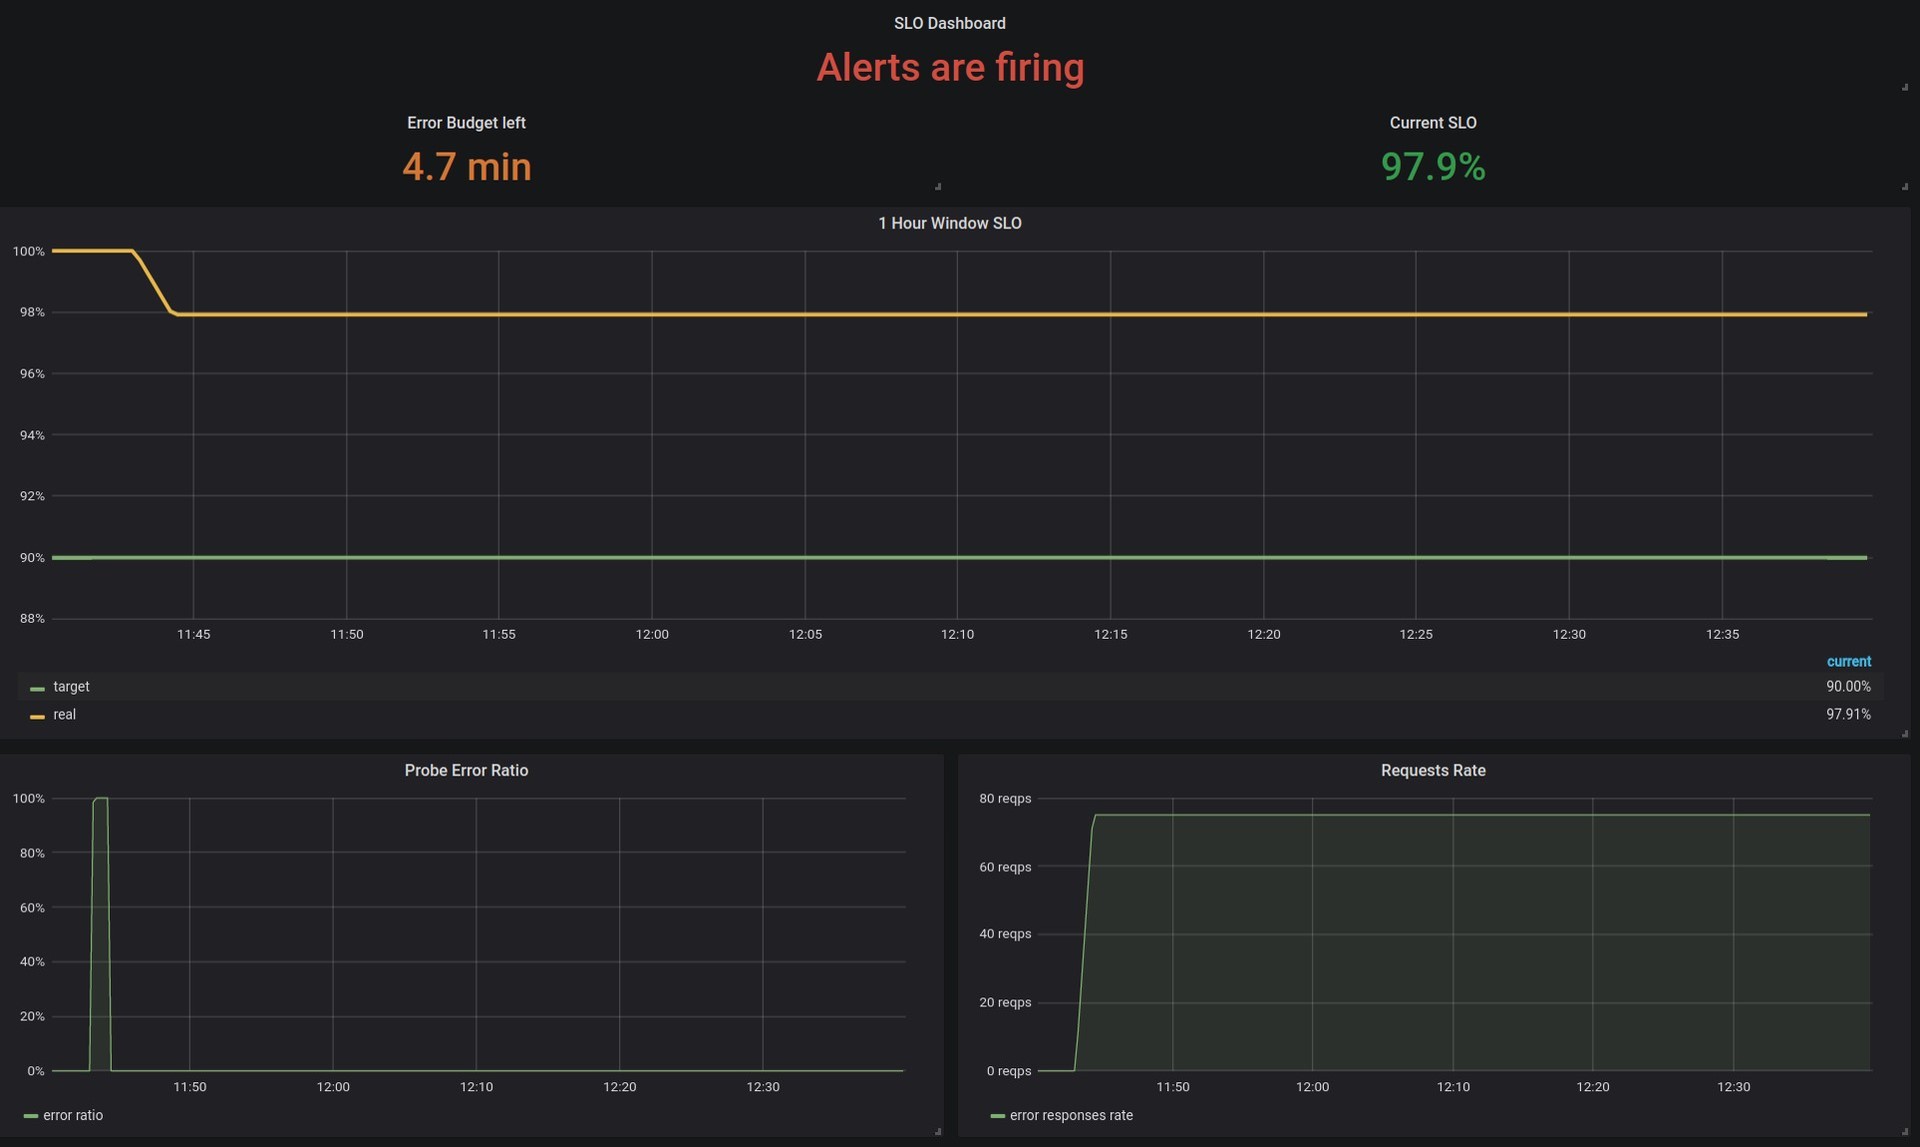
- Alerts are firing - there are alerts firing for the last 5 minutes, pay attention.
The titles for both states can be changed via Vizualization tab, in Value mappings section.
Welcome to contribute!
Data source config
Collector config:
Upload an updated version of an exported dashboard.json file from Grafana
| Revision | Description | Created | |
|---|---|---|---|
| Download |