
Easy RabbitMQ (K8S)
RabbitMQ stats (easy to use in kubernetes)
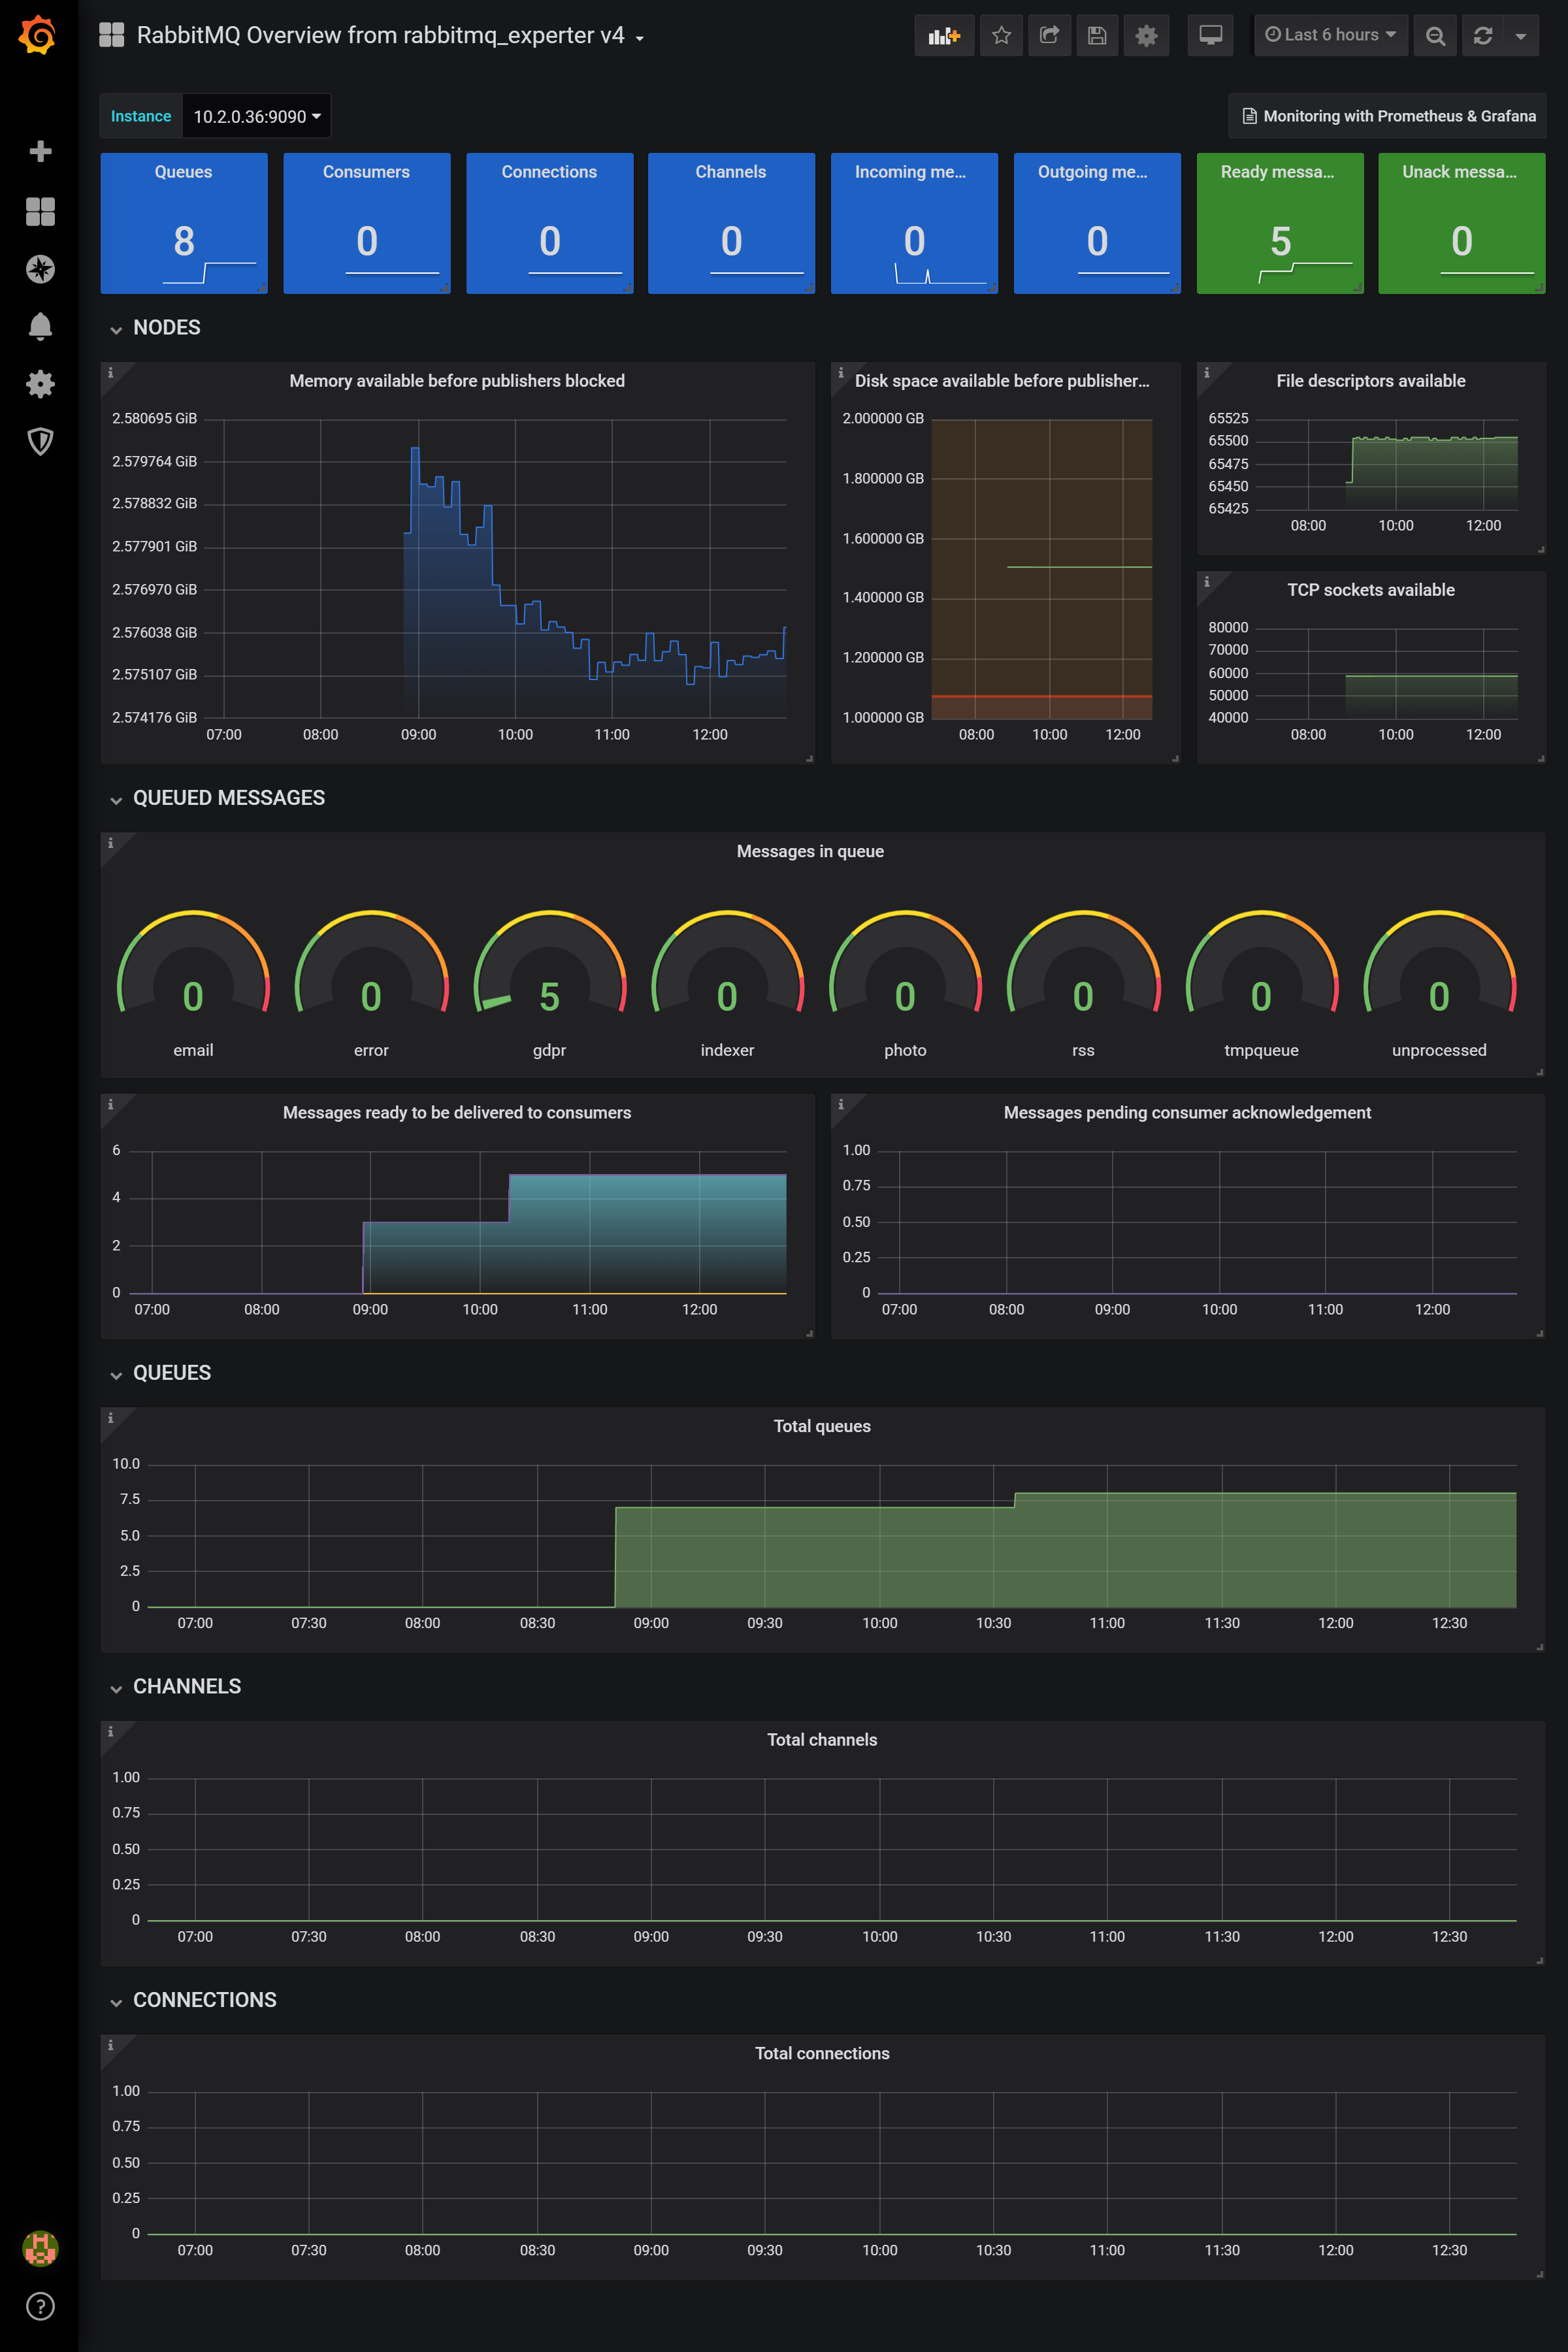
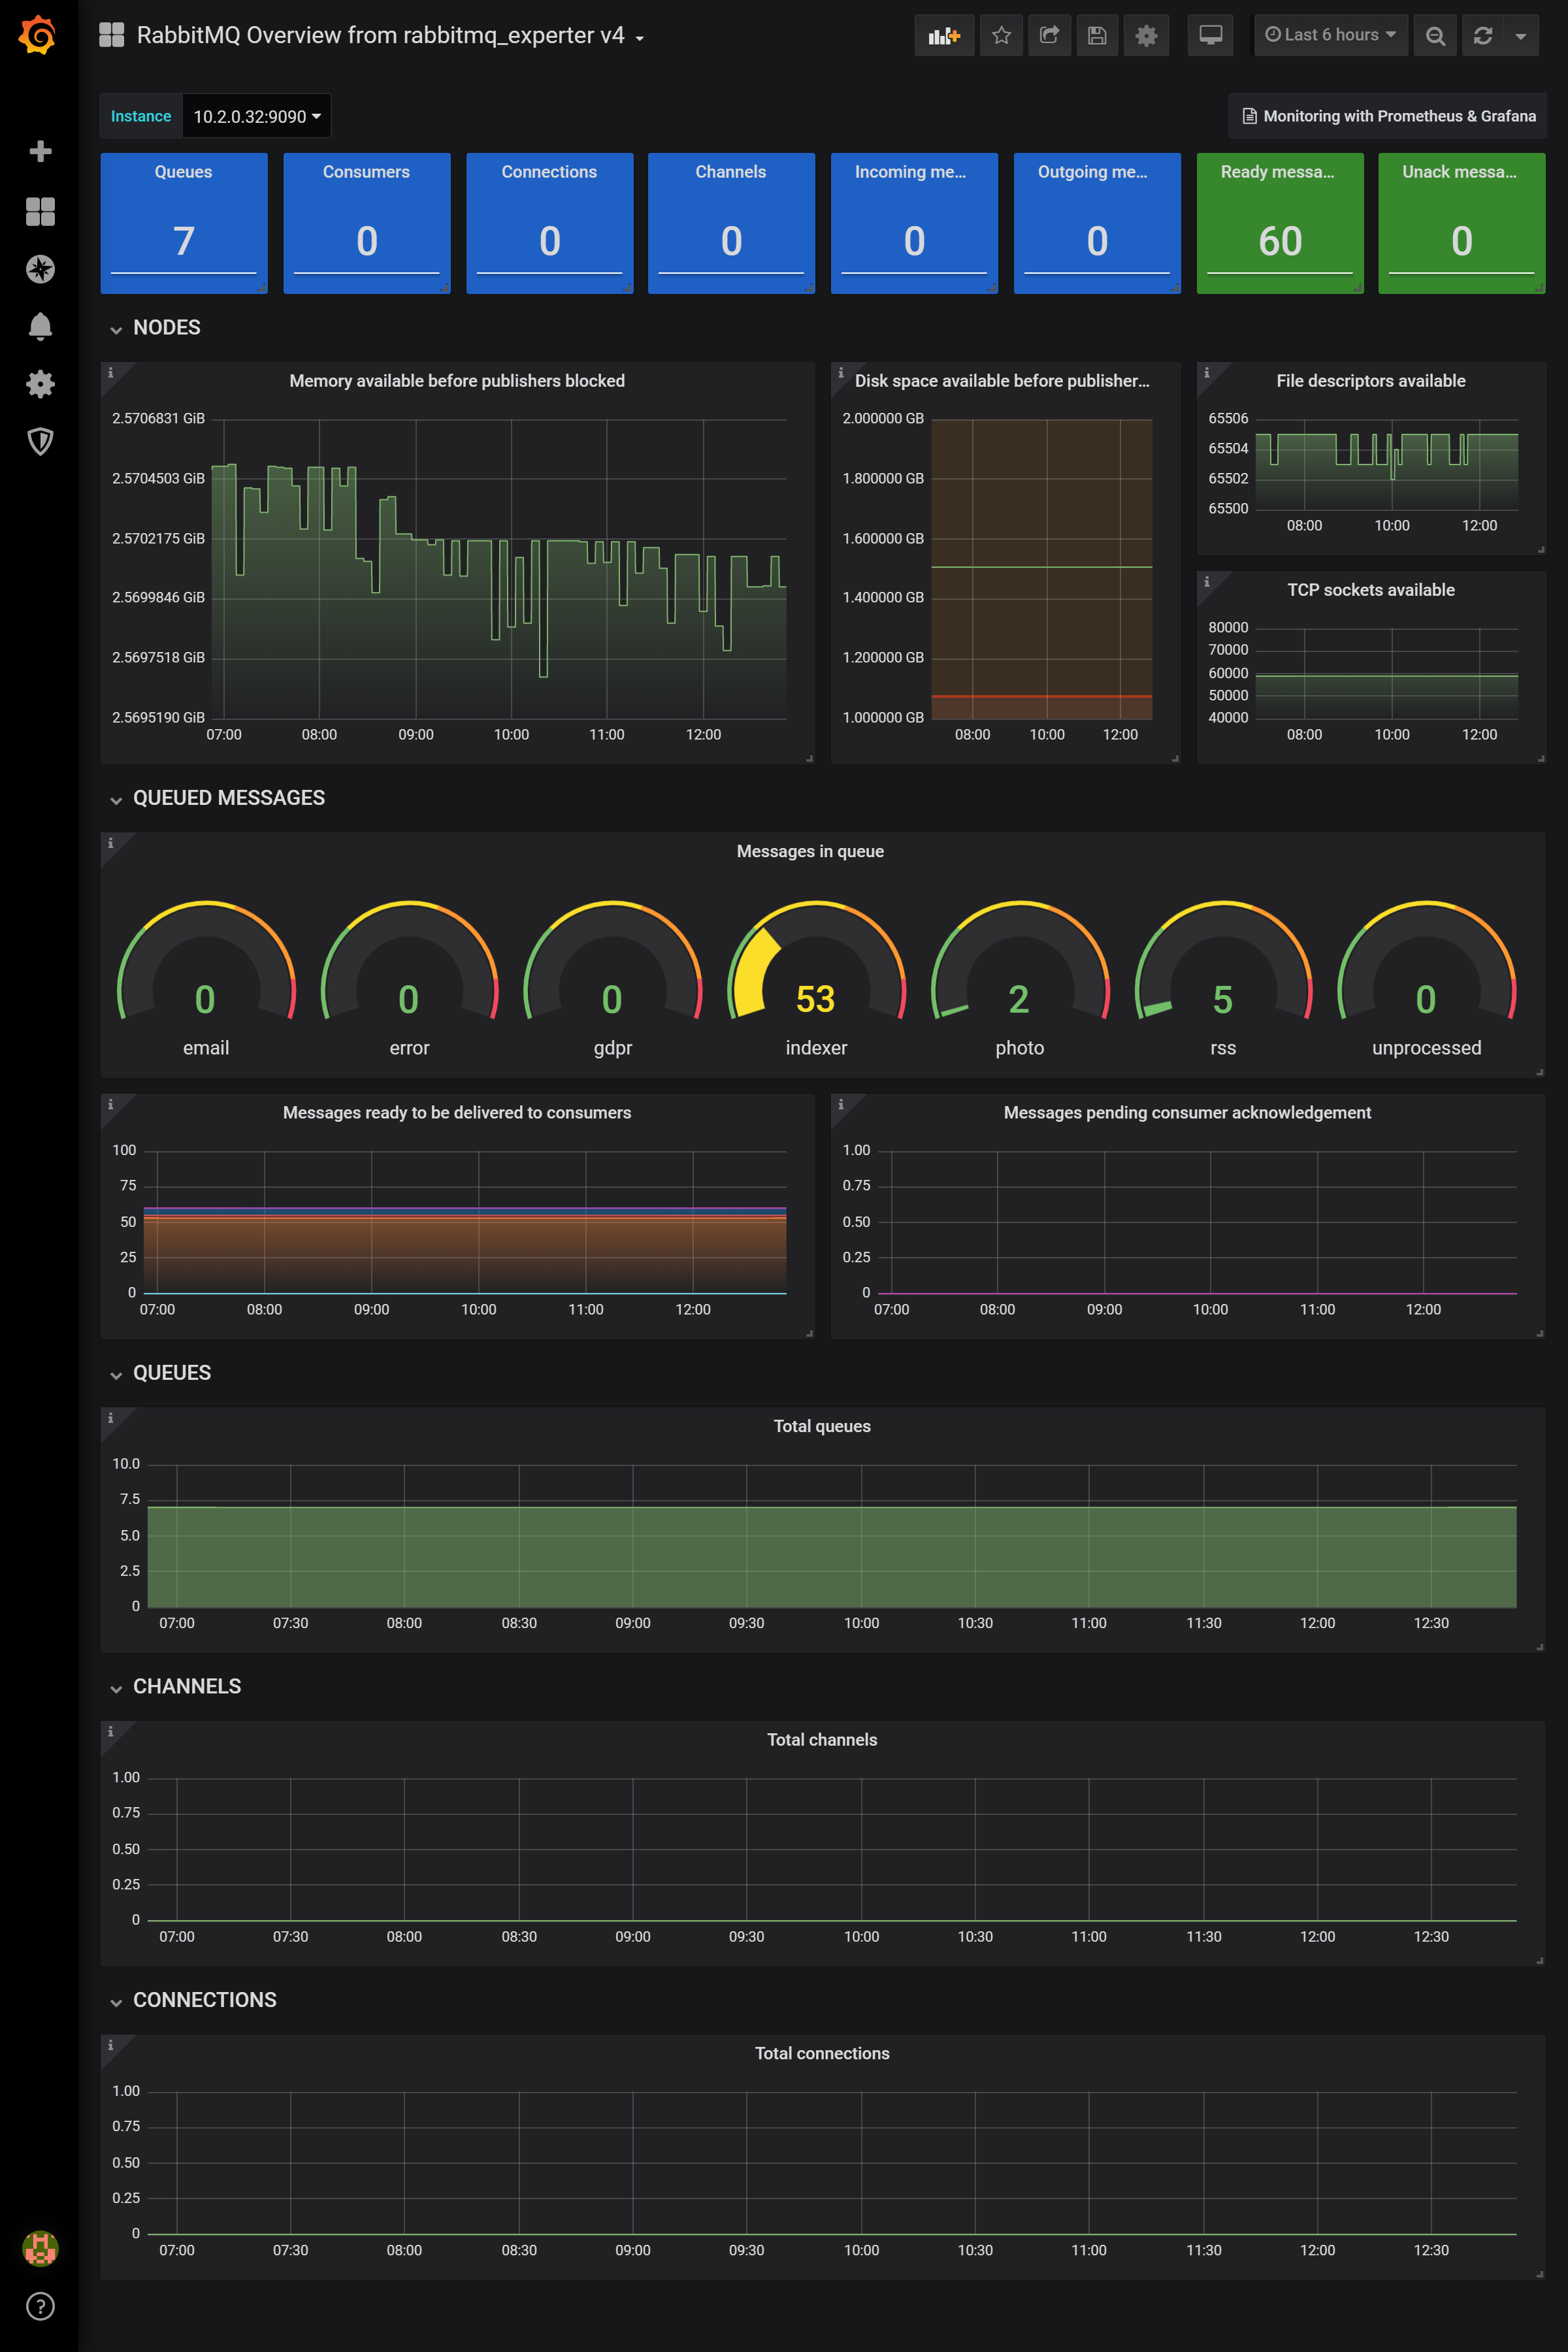
This dashboard is Inspired by the official dashboard from https://next.rabbitmq.com/prometheus.html
It consumes a prometheus datasource.
The user can switch from multiple instances of rabbitmq.
It has been designed it to be used for monitoring multiple rabbitmq (installed using helm) running on kubernetes.
When installing rabbitmq on a k8s cluster:
$ helm install stable/rabbitmq -f values.yaml ....
don't forget to add this in values.yaml to enable metrics
metrics:
  enabled: true
Data source config
Collector type:
Collector plugins:
Collector config:
Revisions
Upload an updated version of an exported dashboard.json file from Grafana
| Revision | Description | Created | |
|---|---|---|---|
| Download |
RabbitMQ
Easily monitor RabbitMQ, the most widely deployed open source message broker, with Grafana Cloud's out-of-the-box monitoring solution.
Learn more