
Netdata Monitoring
Netdata Chart
Netdata to InfluxDB exporter
- GitHub
- Zero-config, no need to modify netdata settings
- Uses the Netdata V1 API to pull data (
dashboard_url + '/api') - Periodically writes data to InfluxDB
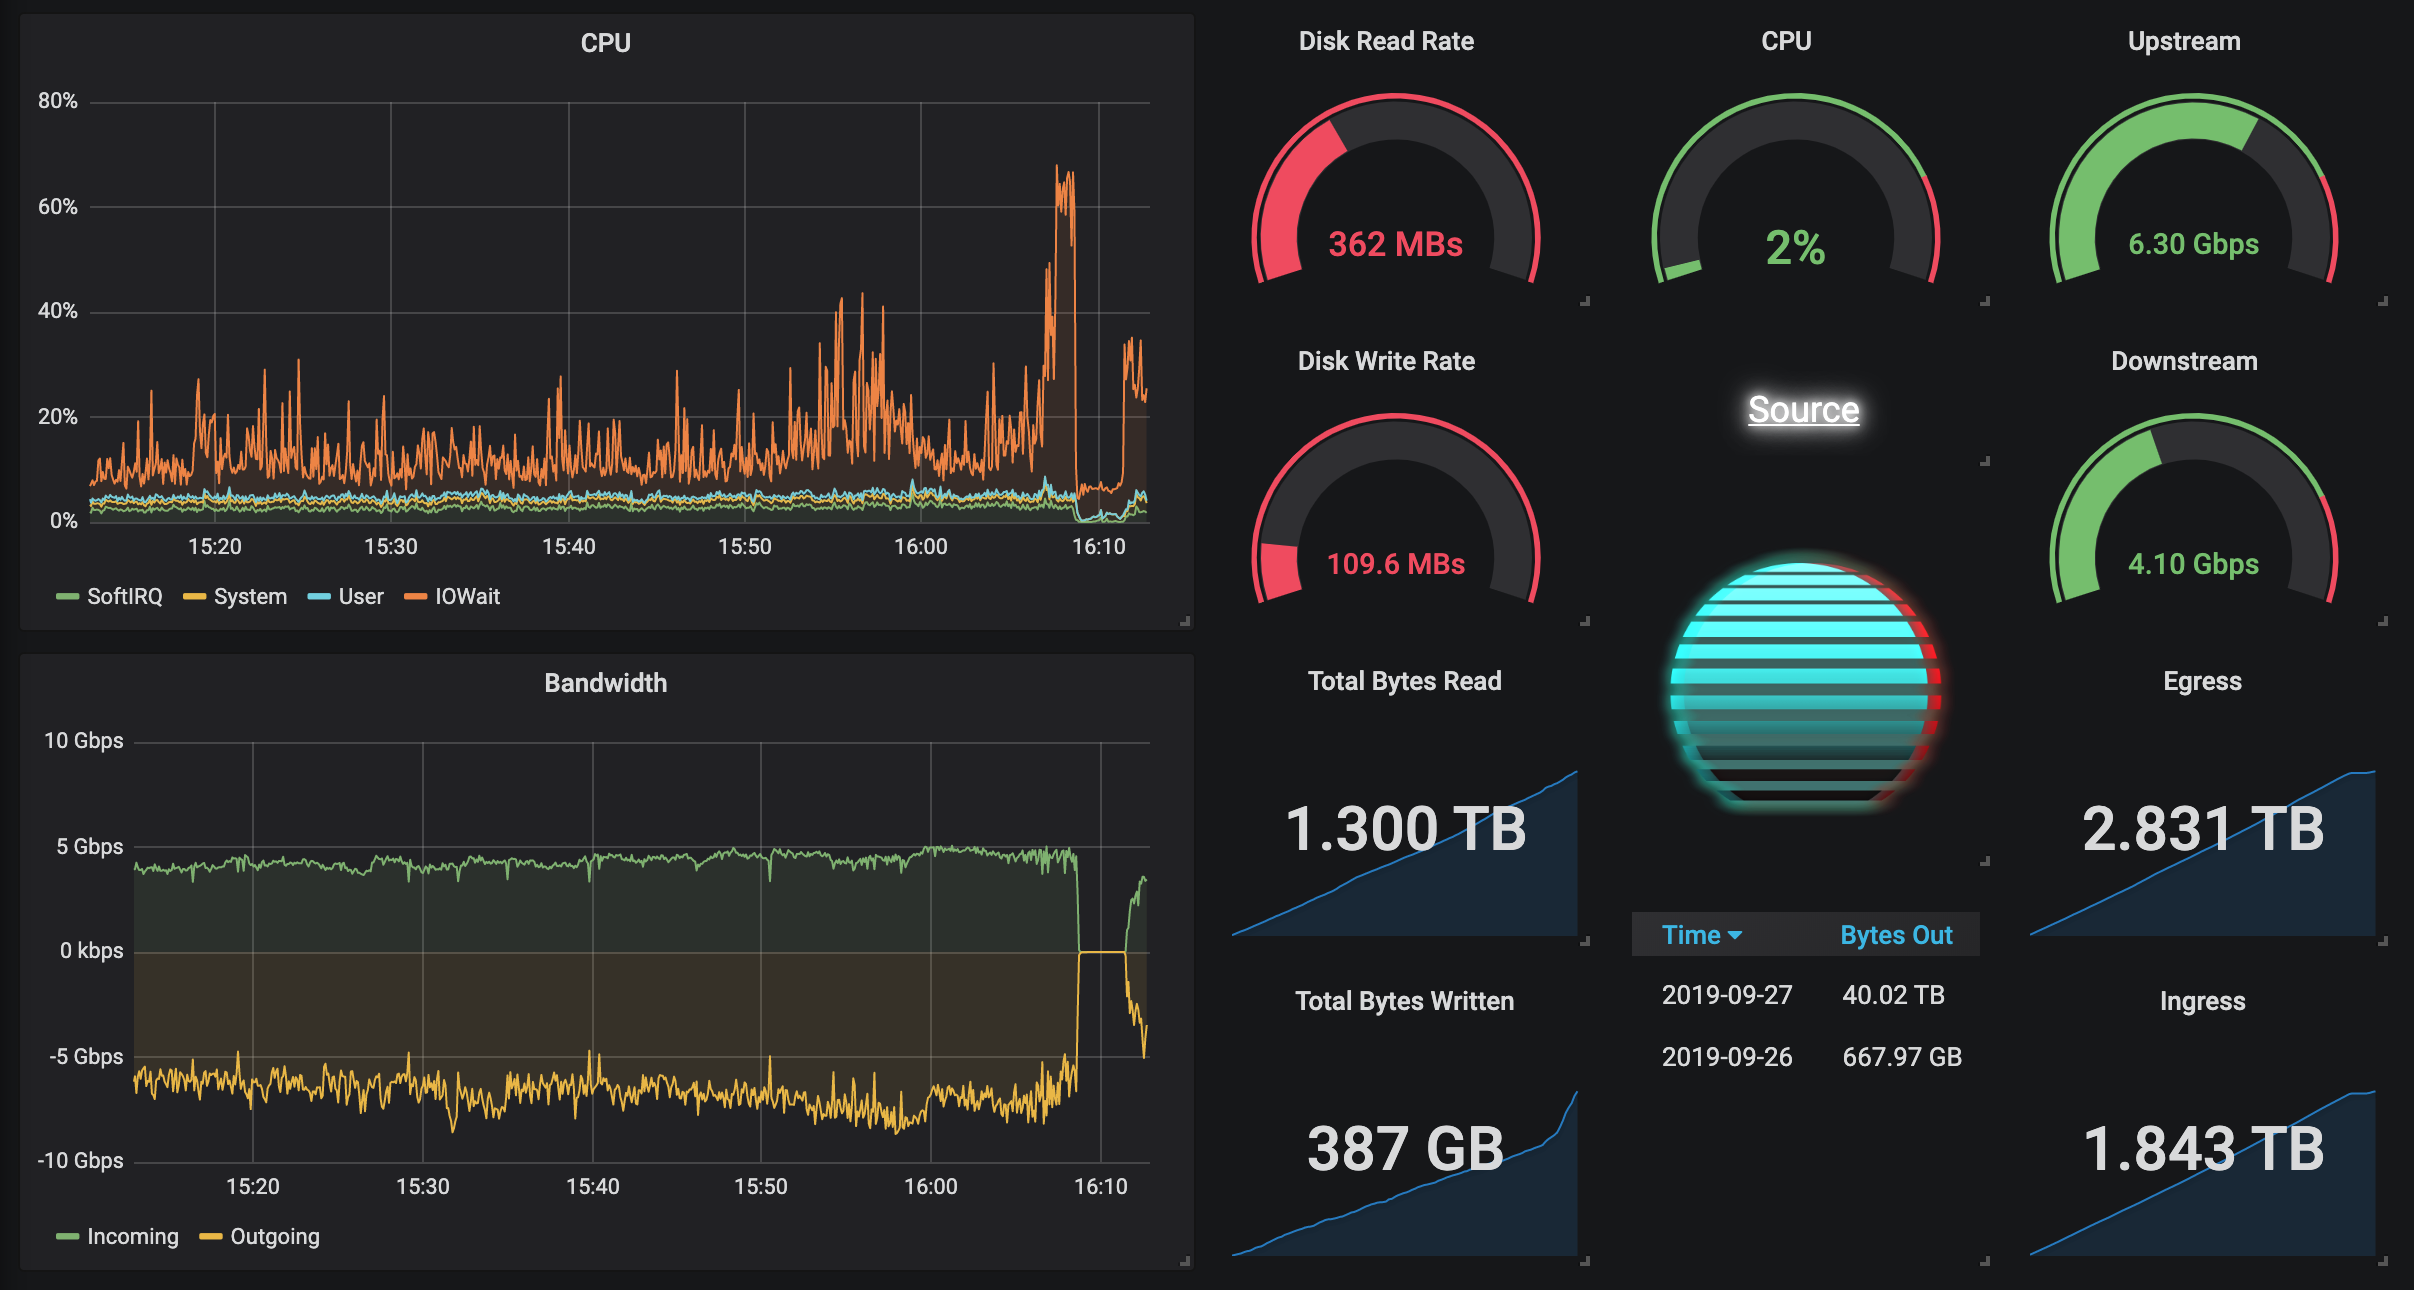
Showcase
Demo Page

Quickstart
Install InfluxDB, Netdata and Grafana using Docker Compose in under a minute!
Console:
# Create workspace
mkdir netdata; cd netdata
Get docker-compose config
wget https://raw.githubusercontent.com/terorie/netdata-influx/master/quickstart/docker-compose.yml
Start services
docker-compose up -d
Create netdata database
curl -G http://localhost:8086/query –data-urlencode "q=CREATE DATABASE netdata"
Grafana:
- Visit
http://<your_ip>:3000 - Login with
admin:admin - Add InfluxDB datasource
- URL:
http://influxdb:8086 - Details > Database:
netdata
- URL:
- Import dashboard with ID
10922(help)
Exporter Configuration
To change settings or add more charts, use these config variables
| var | meaning | default |
|---|---|---|
$NI_LOG_TIMESTAMPS | Include timestamps in log | "true" |
$NI_INFLUX_ADDR | Influx URL | — |
$NI_INFLUX_DB | Influx database | — |
$NI_REFRESH_RATE | Netdata polling rate | "10s" |
$NI_NETDATA | Netdata API URL | — |
$NI_HOST_TAG | Influx host tag (recommended) | $NI_NETDATA |
$NI_CHARTS | Space-separated list of charts to monitor | system.cpu system.net system.pgpgio |
$NI_POINTS | Number of points to fetch (0 for all) | 0 |
Data source config
Collector type:
Collector plugins:
Collector config:
Revisions
Upload an updated version of an exported dashboard.json file from Grafana
| Revision | Description | Created | |
|---|---|---|---|
| Download |