
cassandra-dashboard
Monitoring for Cassandra clusters
Revision 3: https://grafana.com/api/dashboards/10849/revisions/3/download
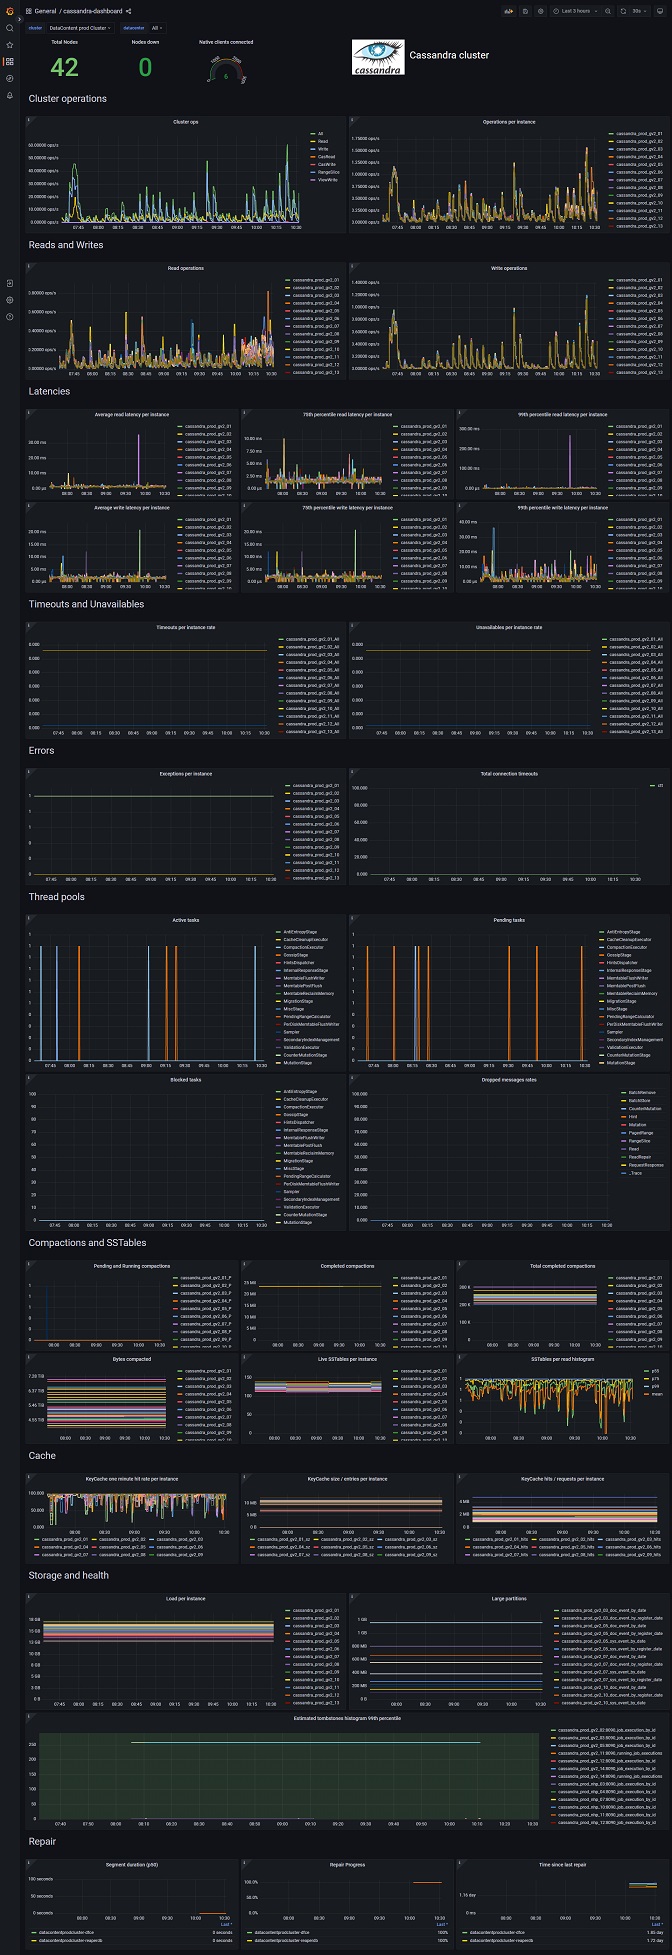
This dashboard shows a set of graphs to monitor the operations of Apache Cassandra clusters. It should be compatible with most versions, except perhaps the "Repair Ratio" graph that only works in recent ones. Among others:
- Global cluster operations [per type]
- Operations per instance [per type]
- Latencies
- Active/blocked/pending thread details
- Timeouts, unavailables and other errors
- Cache info
- Compaction information
- Load per instance
- Large partitions
- Tombstones
- Repair status and progress
The backend database is Prometheus, feel free to reuse the Ansible roles I have created:
https://github.com/mimarpe/ansible/tree/master/roles/prometheus-deploy
cassandra-exporter is used as external agent on the Cassandra nodes to get the metrics. It is based on jmx-exporter. You can use the role or template configuration here to deploy it:
Cassandra-Reaper is used for repair scheduling and for the metrics used in the dashboard
Data source config
Collector config:
Upload an updated version of an exported dashboard.json file from Grafana
| Revision | Description | Created | |
|---|---|---|---|
| Download |
Apache Cassandra
Easily monitor Apache Cassandra, the popular open source NoSQL distributed database, with Grafana Cloud's out-of-the-box monitoring solution.
Learn more