MySQL InnoDB Cached Indexes (Designed for PMM)
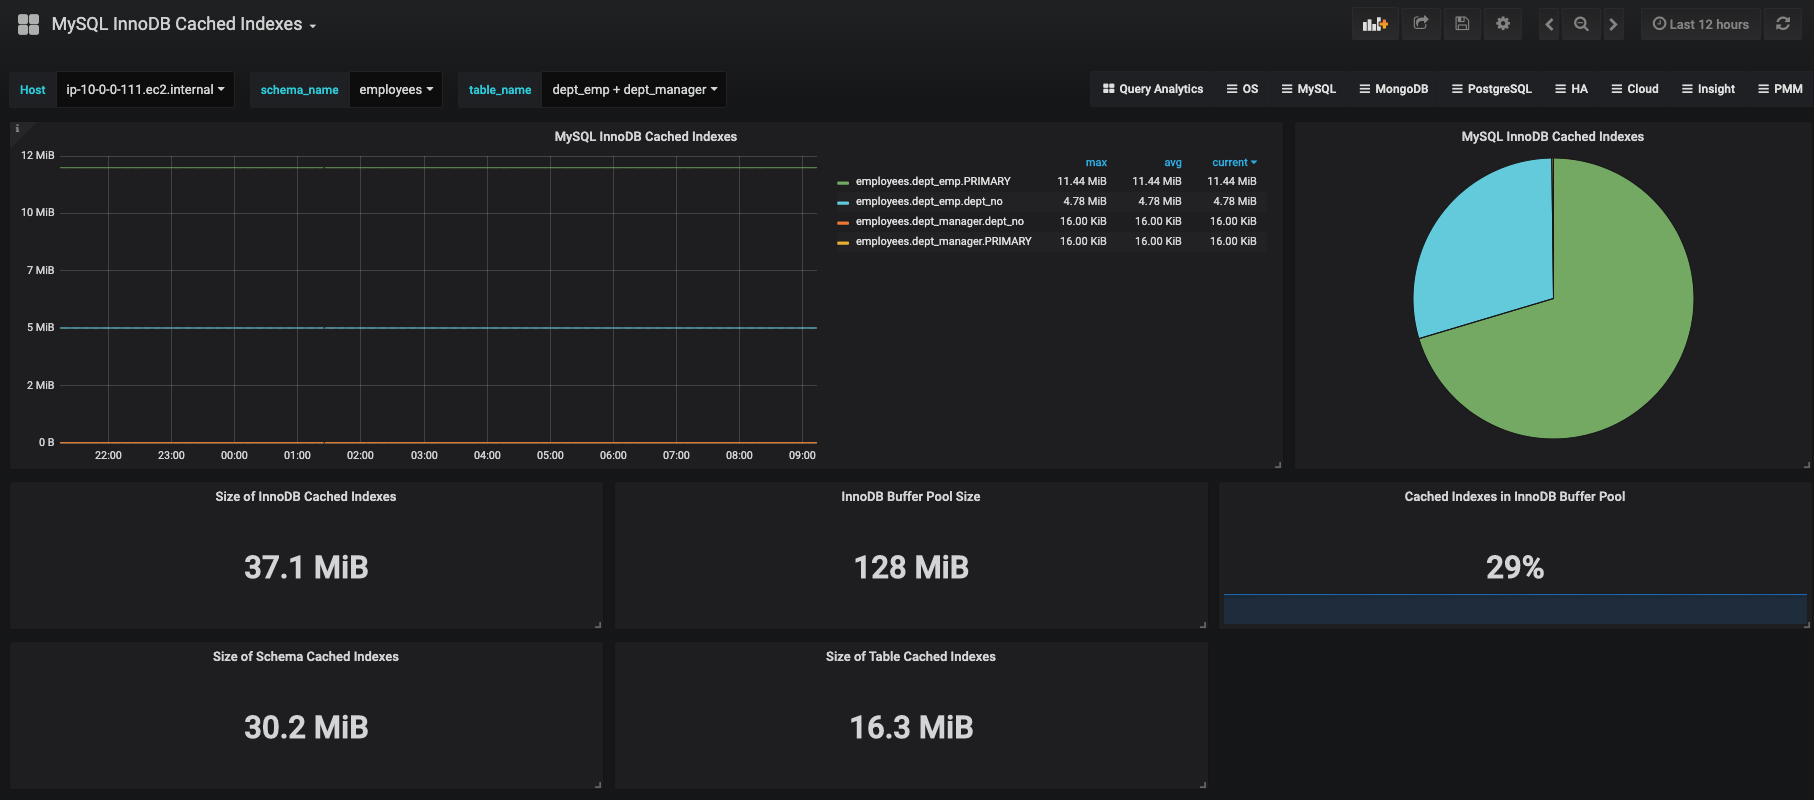
The MySQL InnoDB Cached Indexes dashboard displays the top 20 indexes that are memory resident and the sizes of each index. The pie chart displays the same information in a different view but combines all indexes that take up 3% or less of the total size of all memory-resident indexes, in a pie slice labeled Others. The naming convention is schema_name.table_name.index_name. You are able to display any combination of tables and indexes as you see fit. The 5 statistics displayed at the bottom are the total size of cached indexes on your MySQL instance, the size of the InnoDB buffer pool, the ratio of cached indexes to the size of the InnoDB buffer pool, the size of the selected schema’s cached indexes, and the size of the selected table’s cached indexes.
Download the queries-mysqld.yml file from here.
The README.md has installation instructions for queries-mysqld.yml. Instead of importing the .json, paste (number) for the dashboard ID, and select Load.
Data source config
Collector config:
Upload an updated version of an exported dashboard.json file from Grafana
| Revision | Description | Created | |
|---|---|---|---|
| Download |
MySQL
Monitor MySQL with Grafana. Easily monitor your MySQL deployment with Grafana Cloud's out-of-the-box monitoring solution.
Learn more
