
Pod Stats & Info
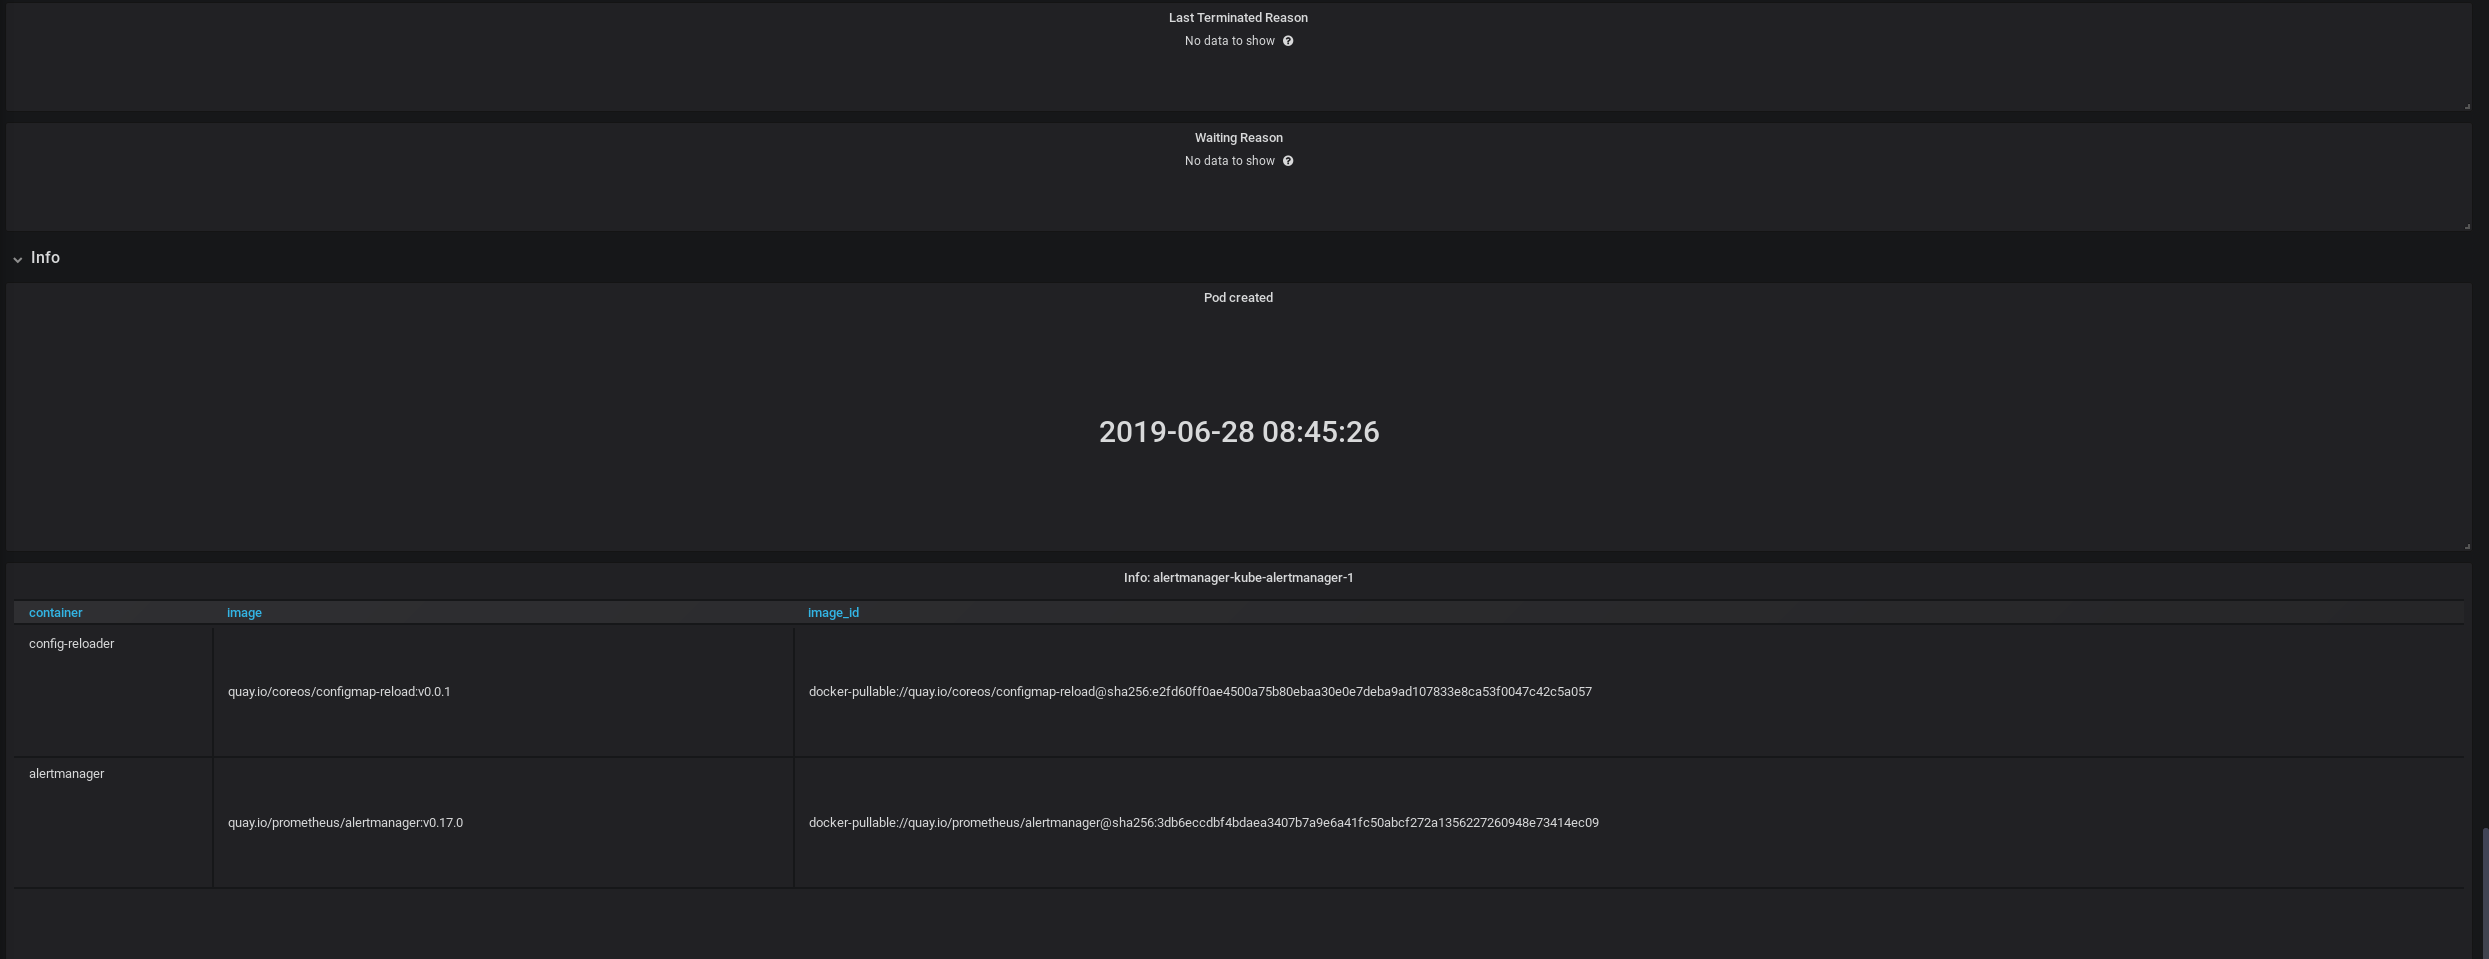
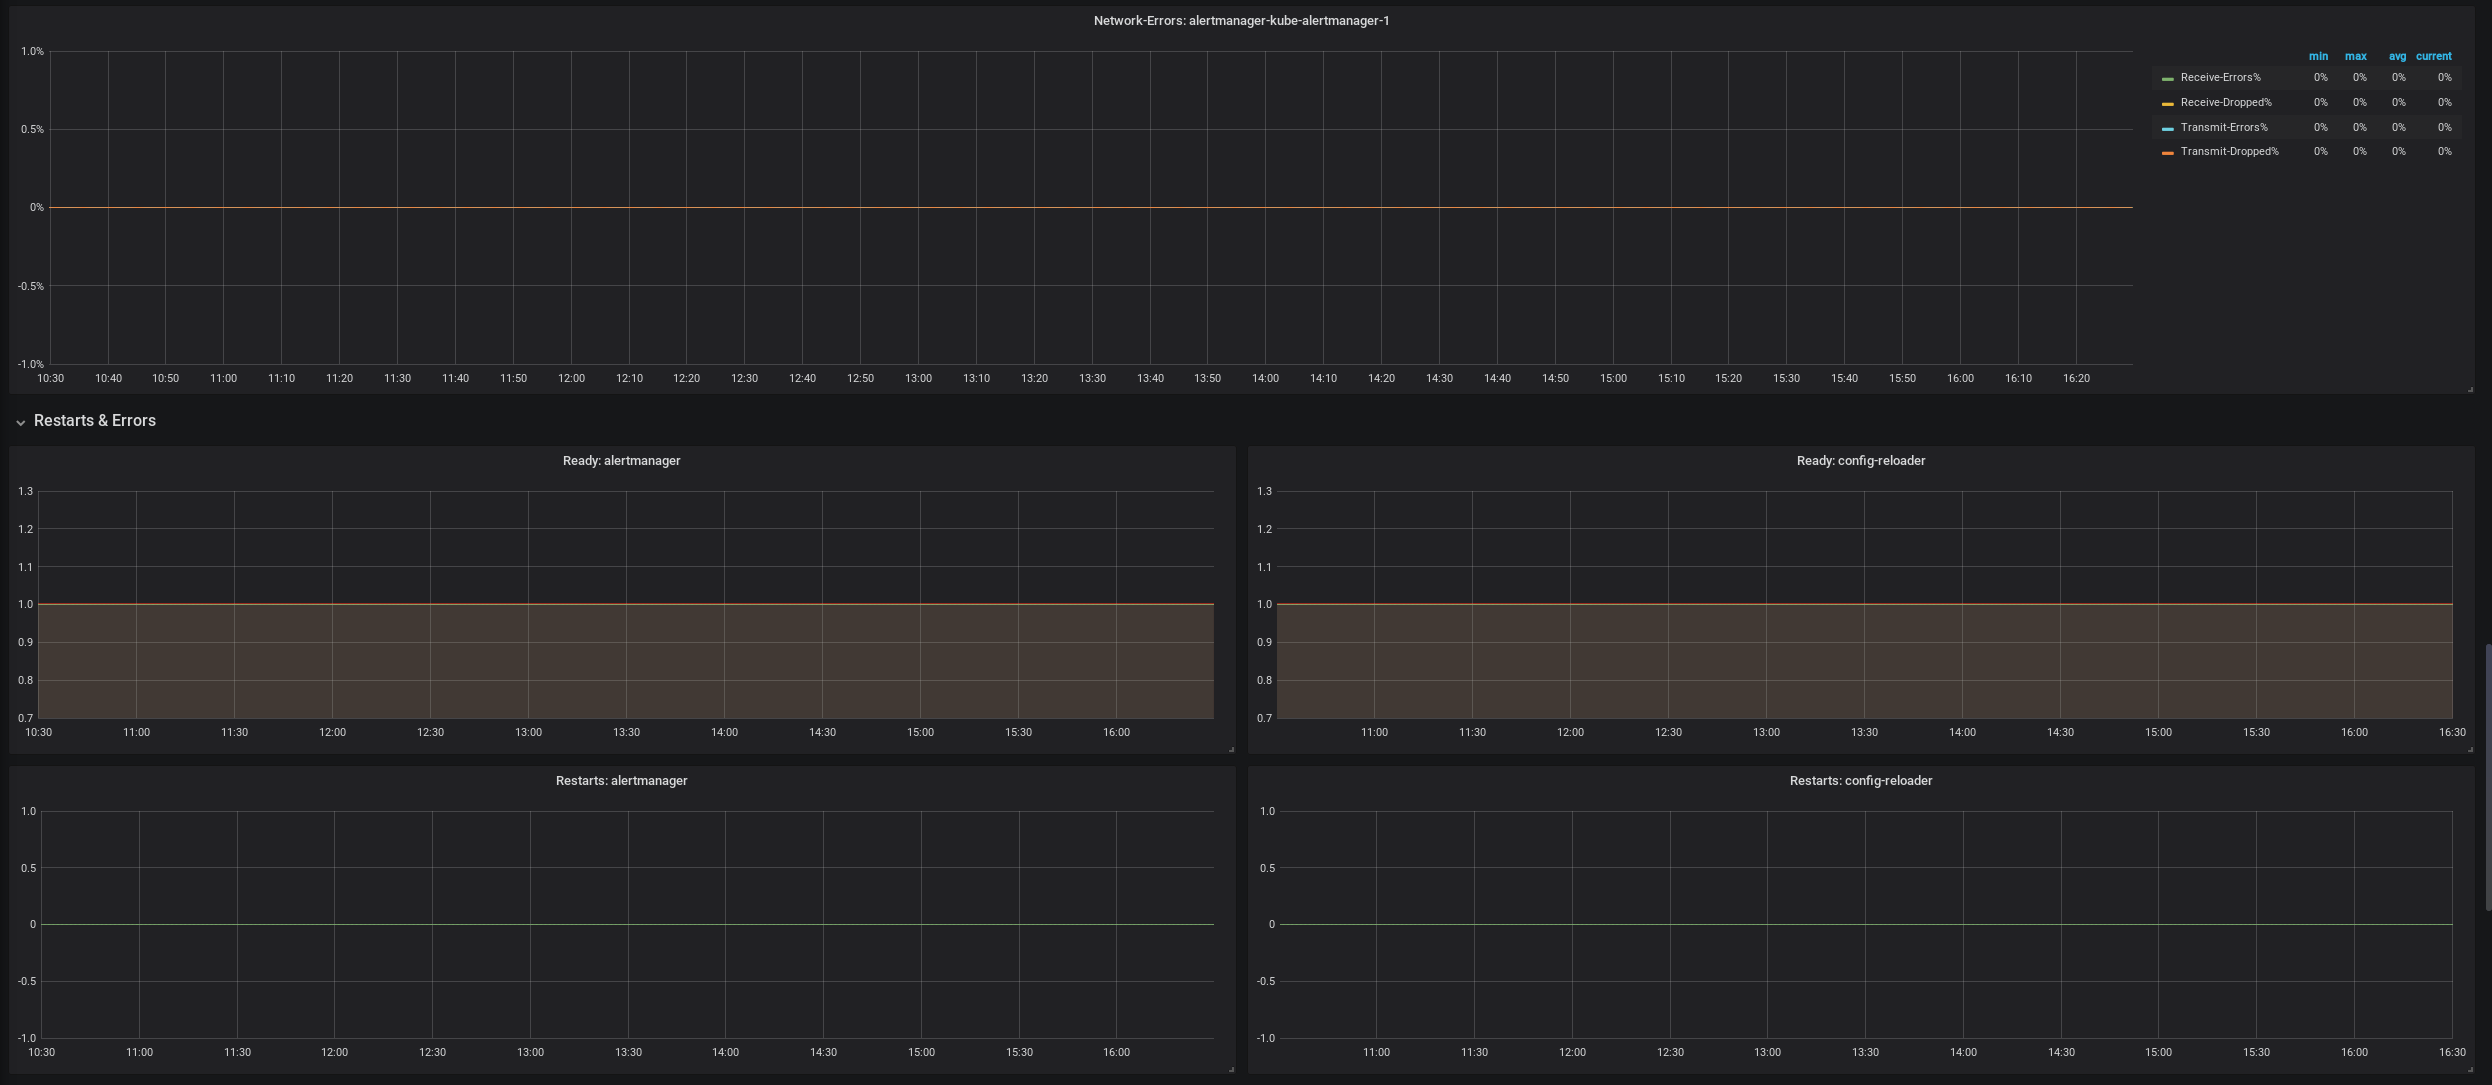
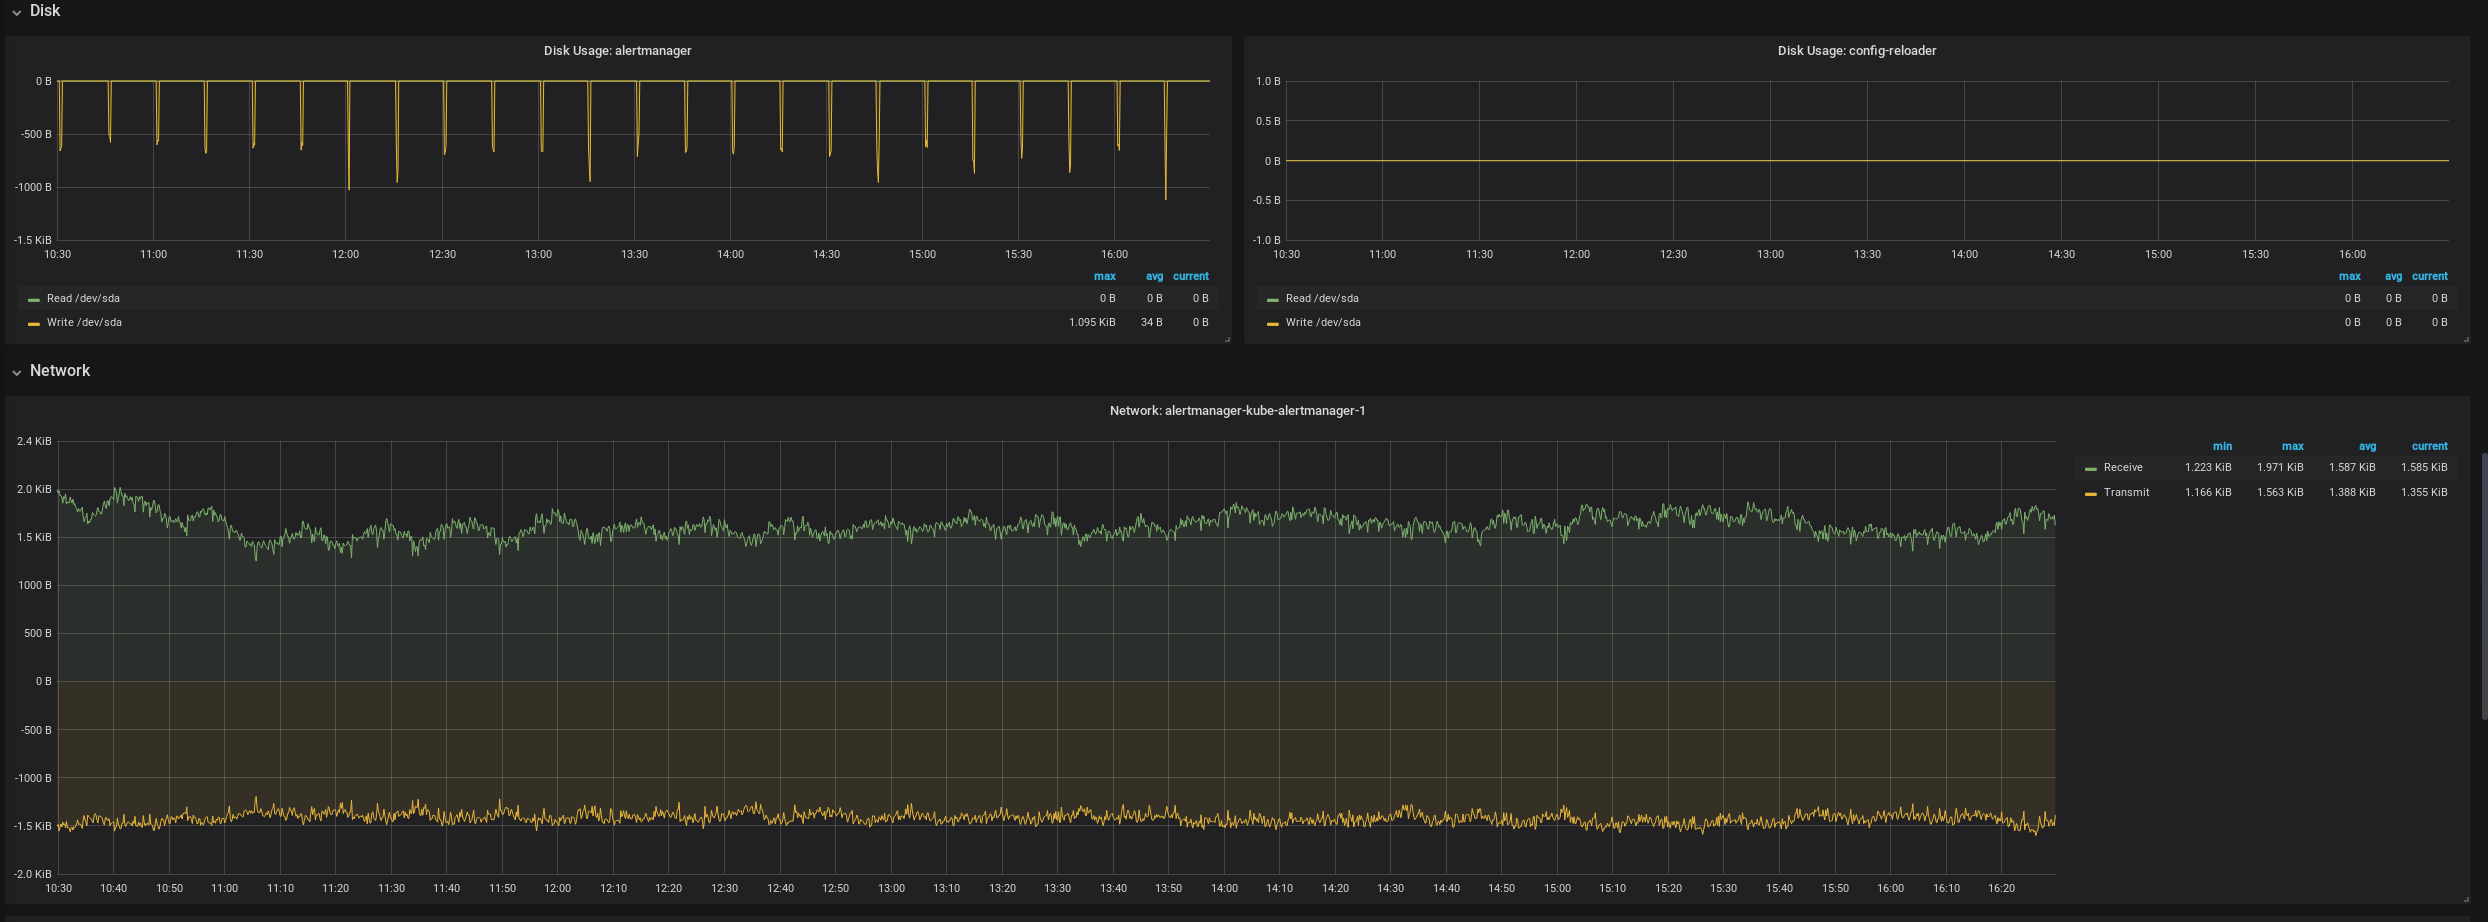
This is for insight on important Kubernetes app metrics. What recources is a Pod actually using and what are it's limits or requests and what part is each container consuming? Also has graphs for networking, disks, restarts docker images etc
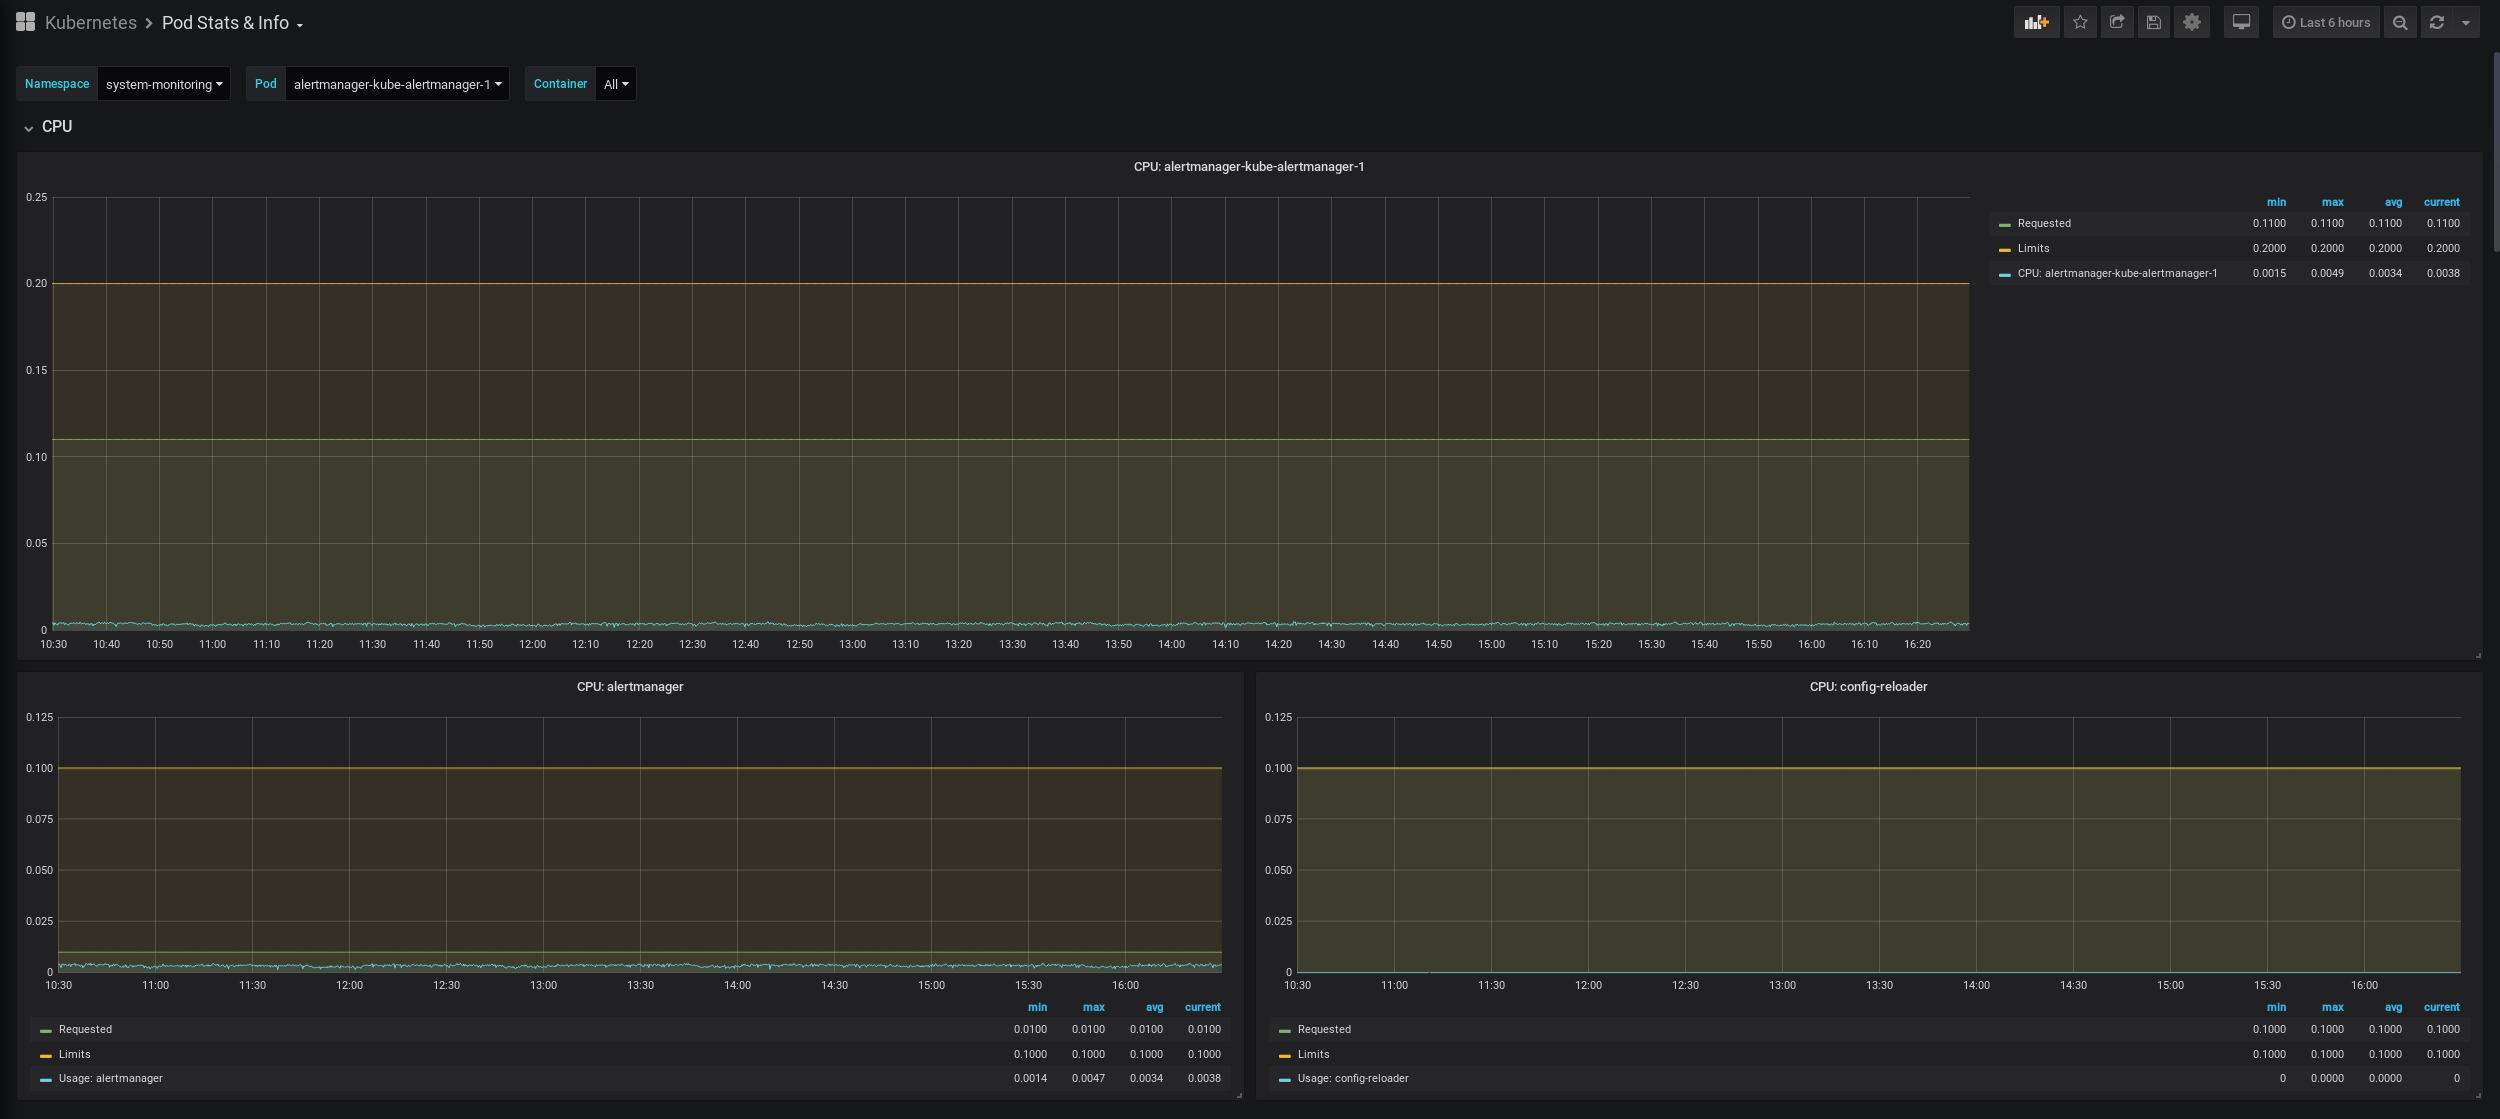
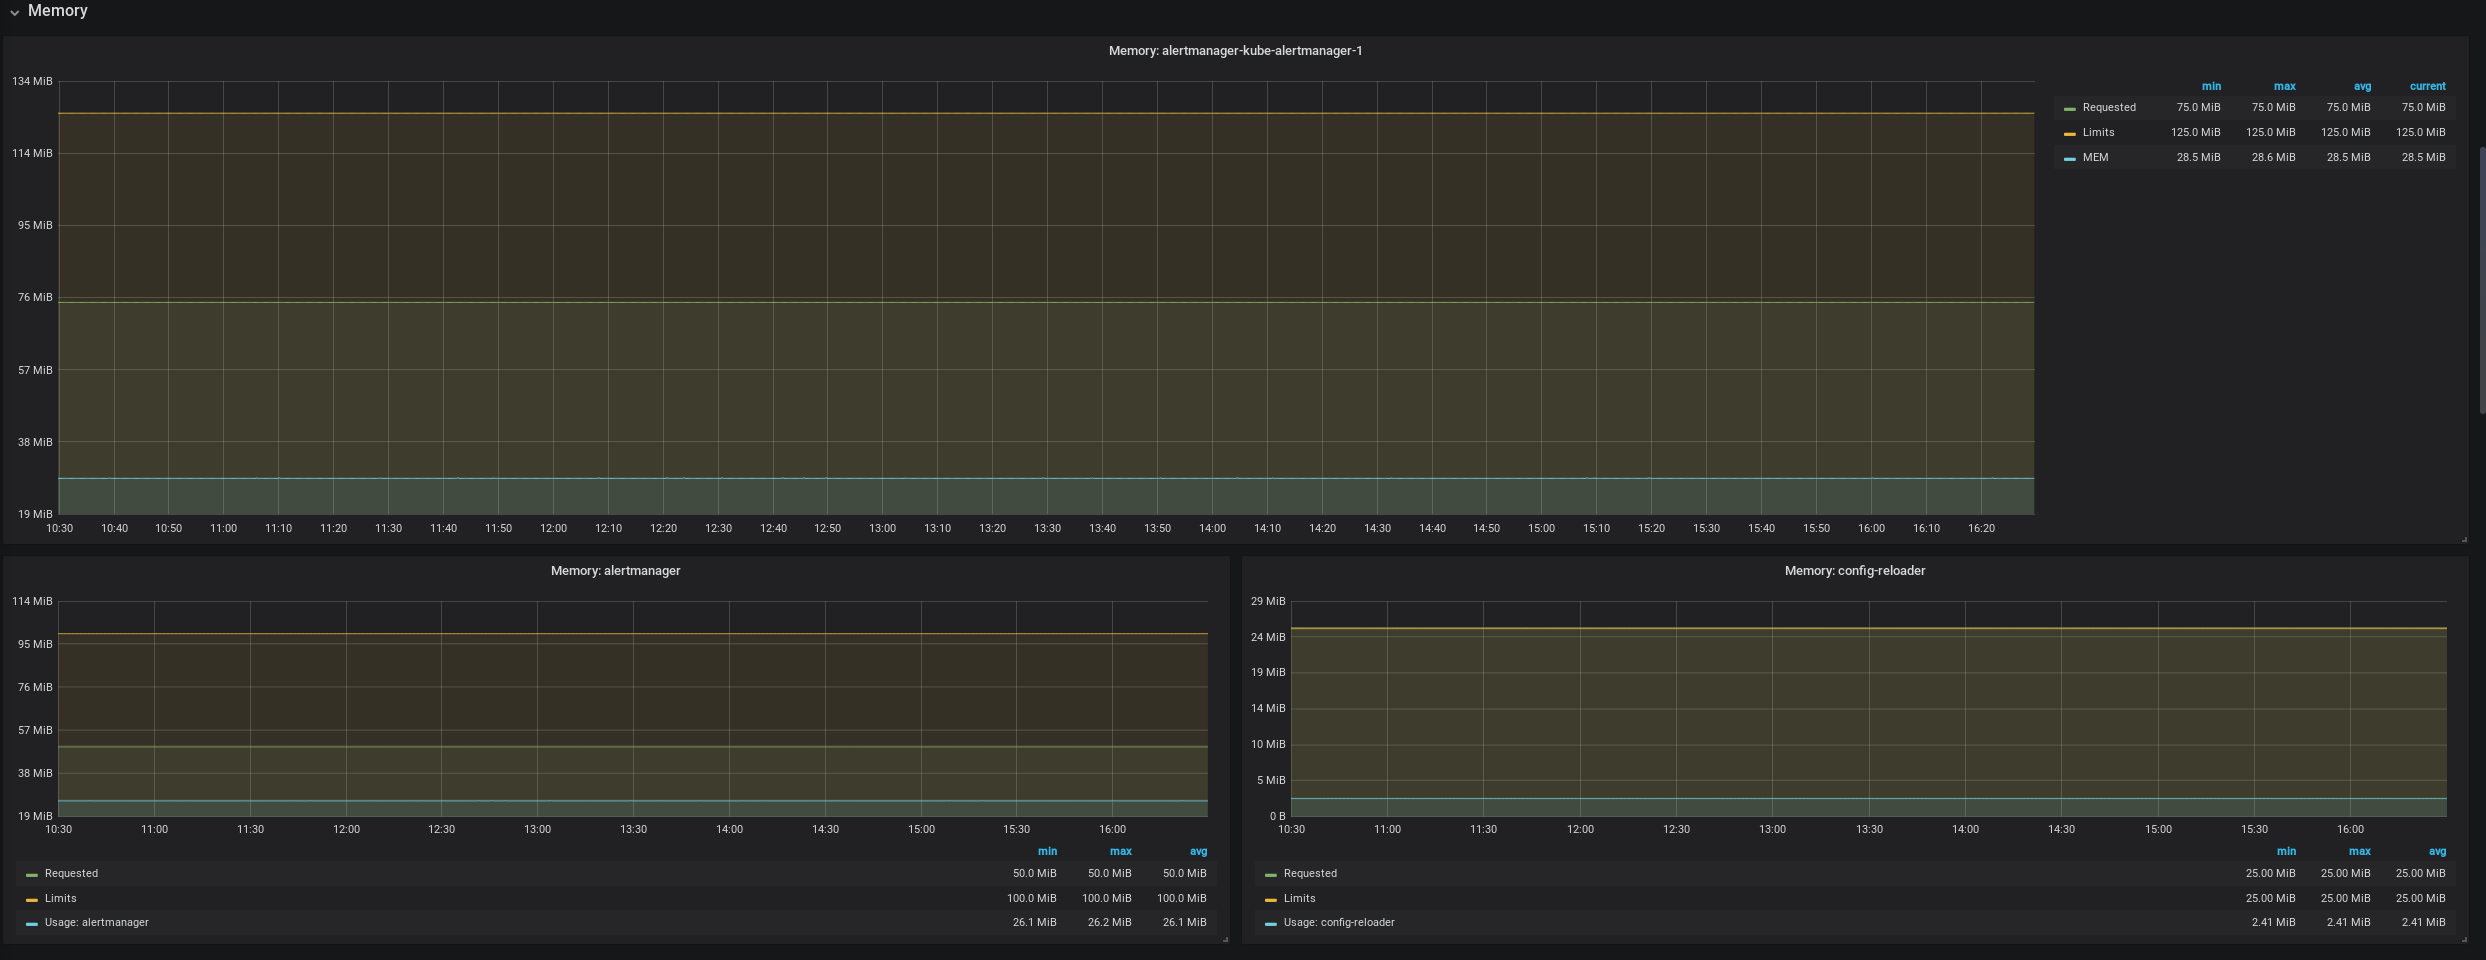
The Pod Stats & Info dashboard uses the prometheus data source to create a Grafana dashboard with the graph, stat and table-old panels.
Data source config
Collector type:
Collector plugins:
Collector config:
Revisions
Upload an updated version of an exported dashboard.json file from Grafana
| Revision | Description | Created | |
|---|---|---|---|
| Download |