network interface stats screen 1.png
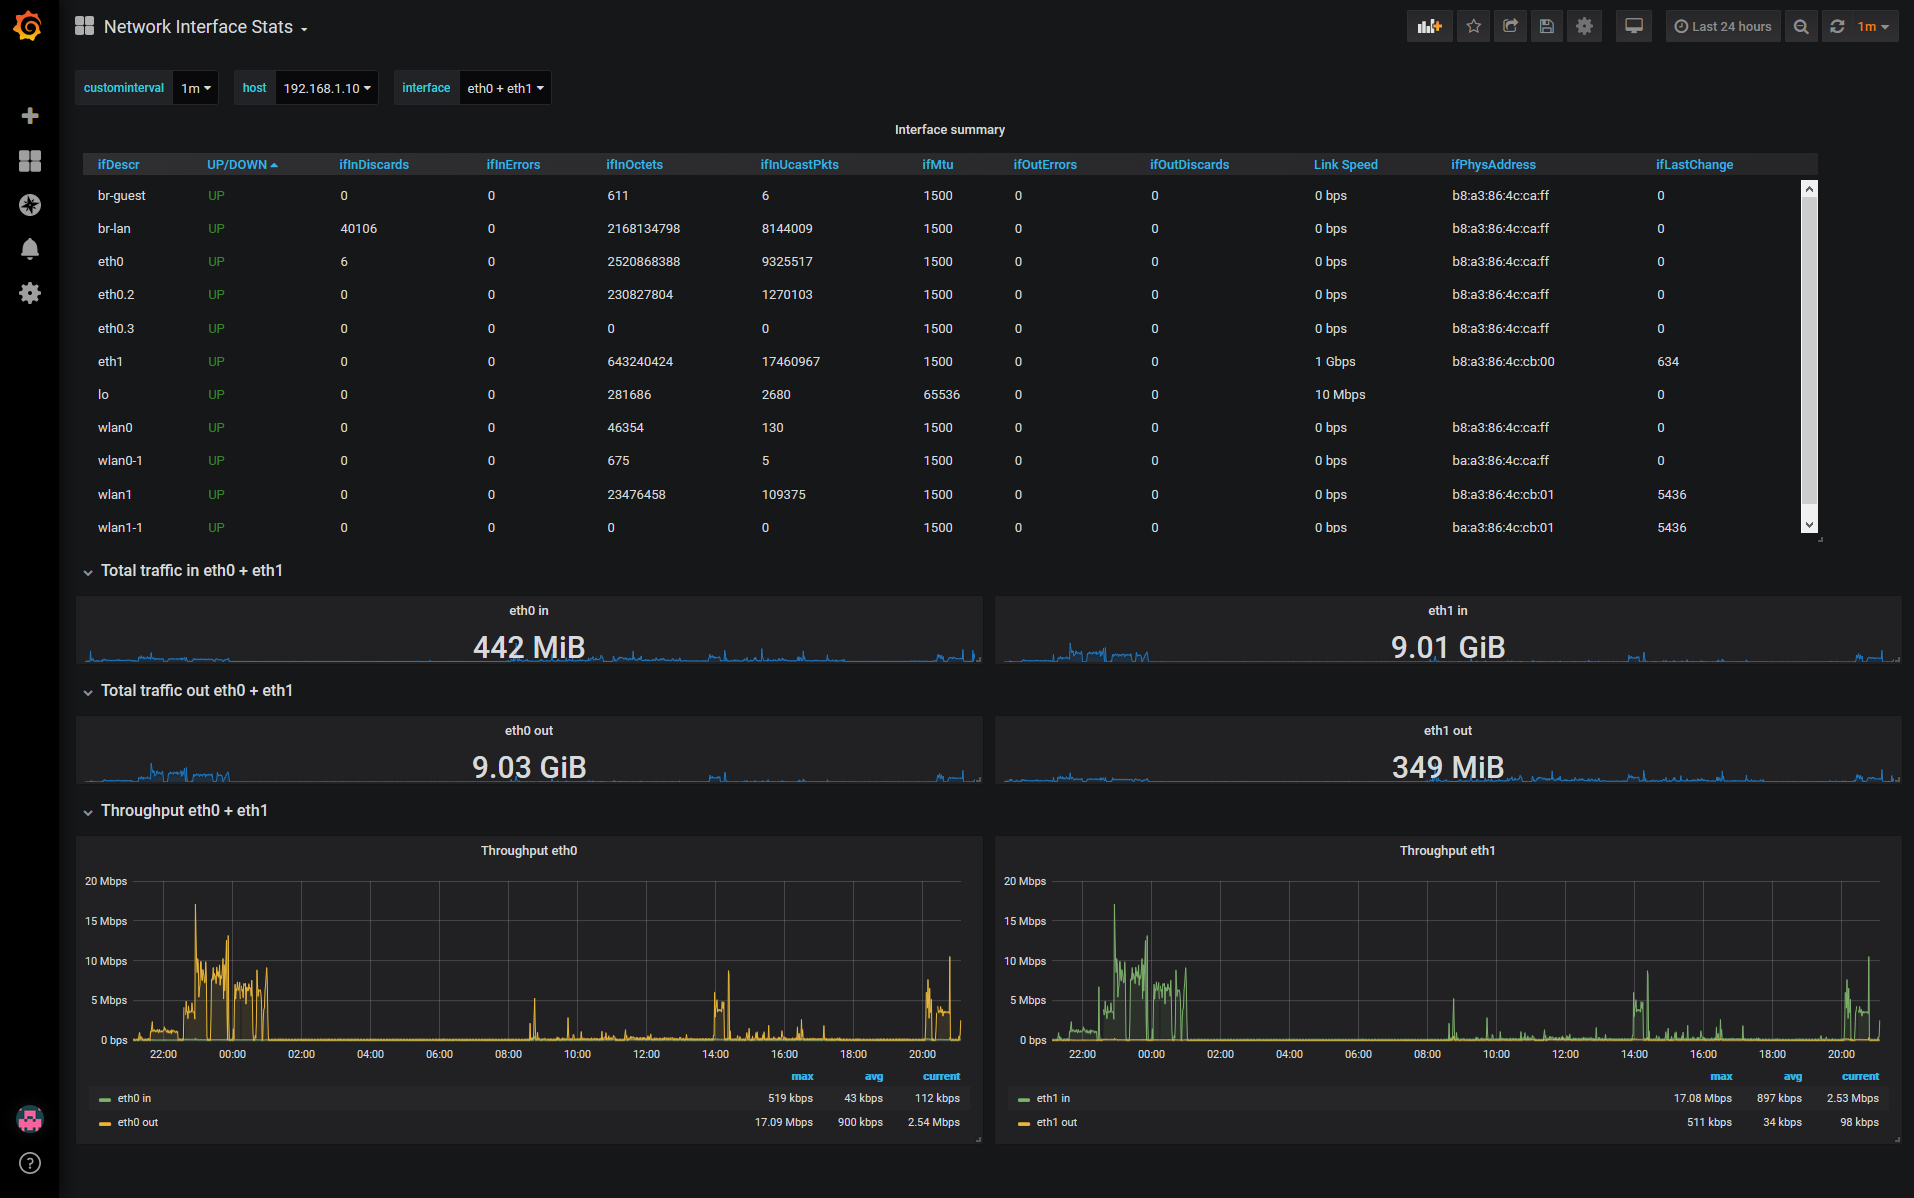
Templated dashboard which provides an overview for your router/switch ports and detailed traffic statistics. The data is gathered by Telegraf over SNMP and is collected in a InfluxDB.
Collector Configuration Details
field configuration in inputs.snmp section
[[inputs.snmp]]
[[inputs.snmp.field]]
name = "hostname"
oid = ".1.0.0.1.1"
[[inputs.snmp.field]]
name = "uptime"
oid = ".1.0.0.1.2"
# IF-MIB::ifTable contains counters on input and output traffic as well as errors and discards.
[[inputs.snmp.table]]
name = "interface"
inherit_tags = [ "hostname" ]
oid = "IF-MIB::ifTable"
# Interface tag - used to identify interface in metrics database
[[inputs.snmp.table.field]]
name = "ifDescr"
oid = "IF-MIB::ifDescr"
is_tag = true
# IF-MIB::ifXTable contains newer High Capacity (HC) counters that do not overflow as fast for a few of the ifTable counters
[[inputs.snmp.table]]
name = "interface"
inherit_tags = [ "hostname" ]
oid = "IF-MIB::ifXTable"
# Interface tag - used to identify interface in metrics database
[[inputs.snmp.table.field]]
name = "ifDescr"
oid = "IF-MIB::ifDescr"
is_tag = true
# EtherLike-MIB::dot3StatsTable contains detailed ethernet-level information about what kind of errors have been logged on an interface (such as FCS error, frame too long, etc)
[[inputs.snmp.table]]
name = "interface"
inherit_tags = [ "hostname" ]
oid = "EtherLike-MIB::dot3StatsTable"
# Interface tag - used to identify interface in metrics database
[[inputs.snmp.table.field]]
name = "ifDescr"
oid = "IF-MIB::ifDescr"
is_tag = true