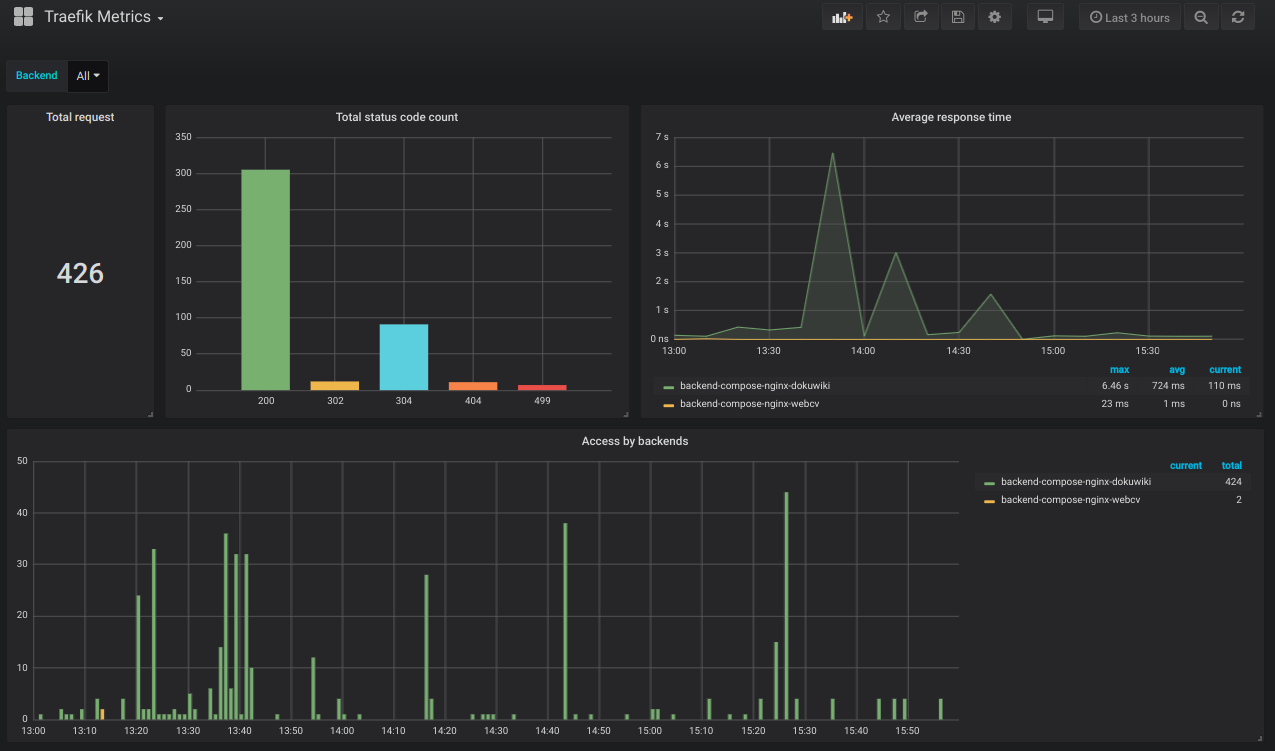
Traefik Metrics
Traefik metrics from Influxdb database
Dashboard for traefik metrics with Influxdb HTTP data source.
Set the traefik.toml file with : [metrics] [metrics.influxdb] address = "host_ip:host_port" protocol = "http" pushinterval = "60s" database = "traefik_metrics" retentionpolicy = "your_retention_policy"
Data source config
Collector config:
Upload an updated version of an exported dashboard.json file from Grafana
| Revision | Description | Created | |
|---|---|---|---|
| Download |
Traefik
Easily monitor Traefik, the dynamic load balancer, with Grafana Cloud's out-of-the-box monitoring solution.
Learn more
