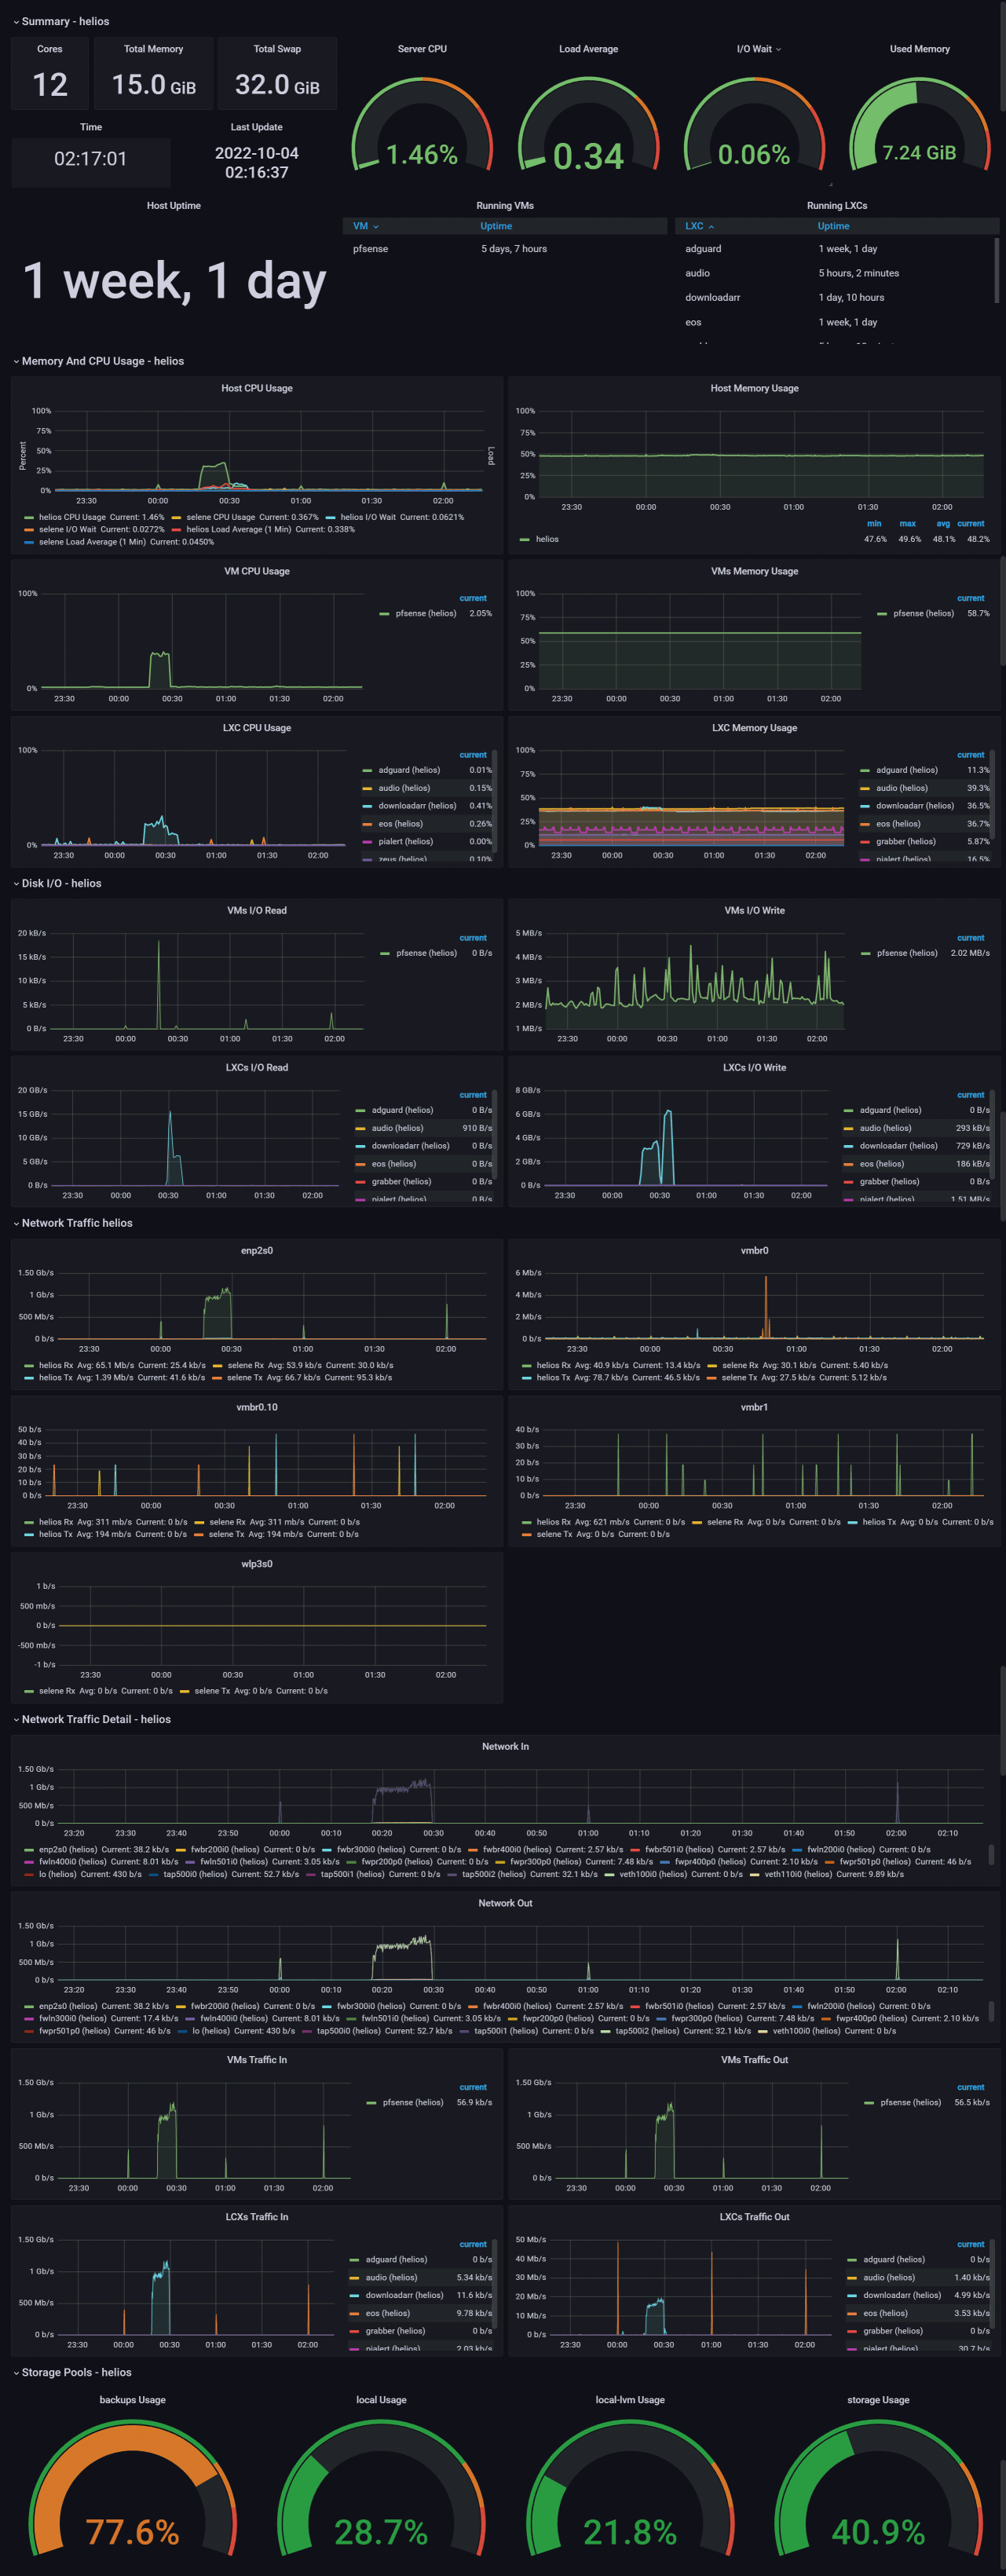
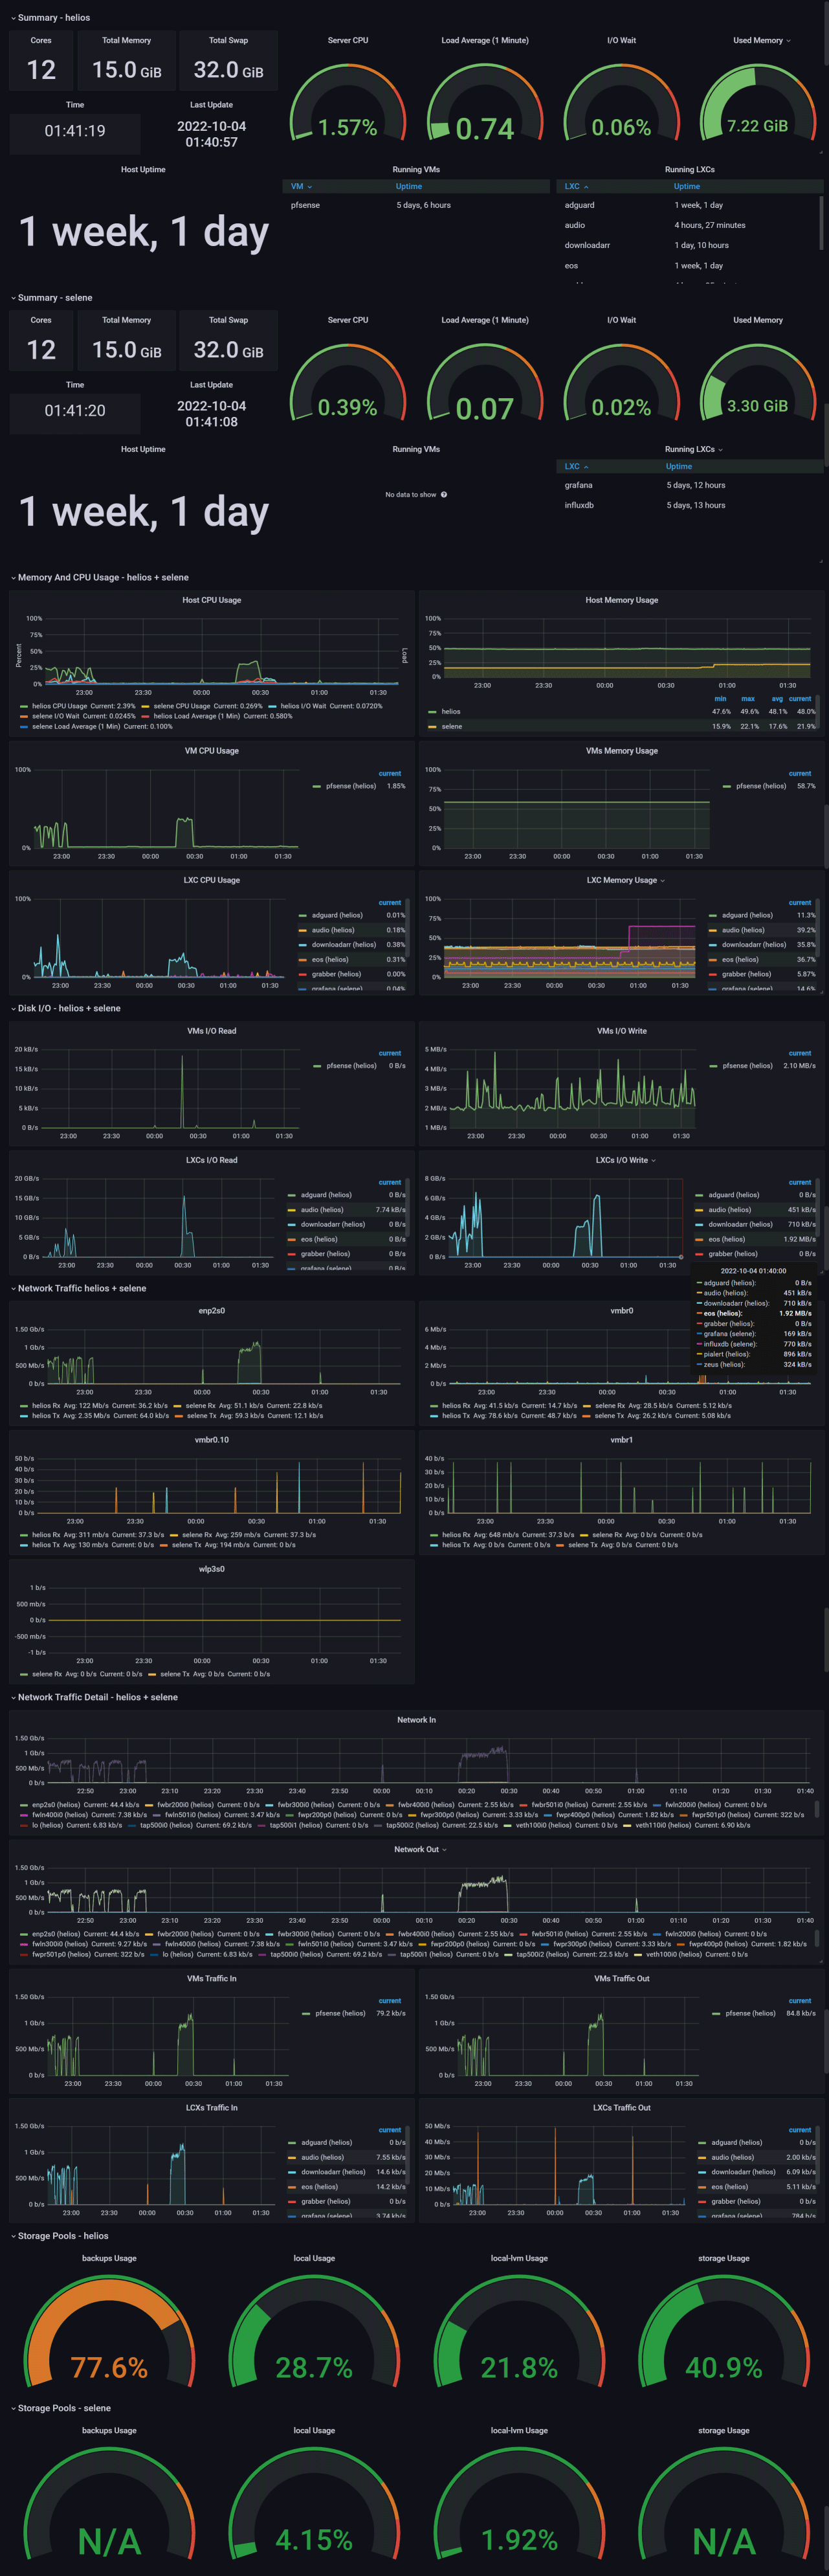
Proxmox
Display data from the Proxmox host and hosted VM's and Containers.
Developed against:
- Proxmox 7.2 but may work with version 4.0 or later. YMMV.
- InfluxDB 1.8.10
- Grafana 9.1.6
Configure Proxmox to talk to your InfluxDB as per https://pve.proxmox.com/wiki/External_Metric_Server then point this dashboard at the resulting database.
Updates in this revision:
- Changed the way a number of stats were calculated to use actual change values rather than rate of change values, resulting in more accurate graphs.
- Automatically sets guage limits based on available hardware
- Handles multiple hosts selected at the same time, in some cases by repeating panels and in others by including data in existing graphs.
- Auto generates graphs for physical and vmbr interfaces (Network Traffic section) based on actual interfaces defined (skips internal interfaces starting veth, tap, fw and lo but you can change this by editing the "interfaces" variable query.
- Auto generates graphs for actually configured storage items.
- Removes a number of hard coded host and interface names.
Data source config
Collector type:
Collector plugins:
Collector config:
Revisions
Upload an updated version of an exported dashboard.json file from Grafana
| Revision | Description | Created | |
|---|---|---|---|
| Download |