
Verify Prometheus metrics are written to an endpoint
While installing and configuring Prometheus in your local environment is out of scope for this journey, a good first step in this journey is to verify that your system is writing metrics to the Prometheus endpoint.
To verify Prometheus metrics are written to an endpoint:
Log into the machine on which Prometheus is installed.
If required, switch to a user that has administrative privileges.
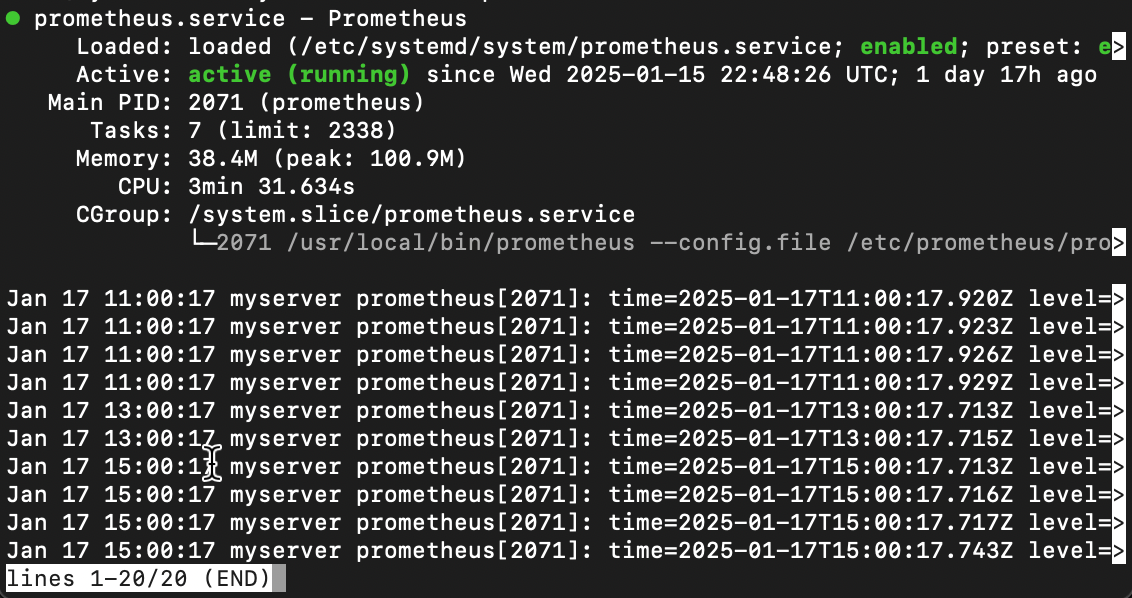
To check the Prometheus service status, run one of the following commands:
For Linux:
systemctl status prometheus.serviceFor Windows:
sc query prometheusYou should see something similar to the following:
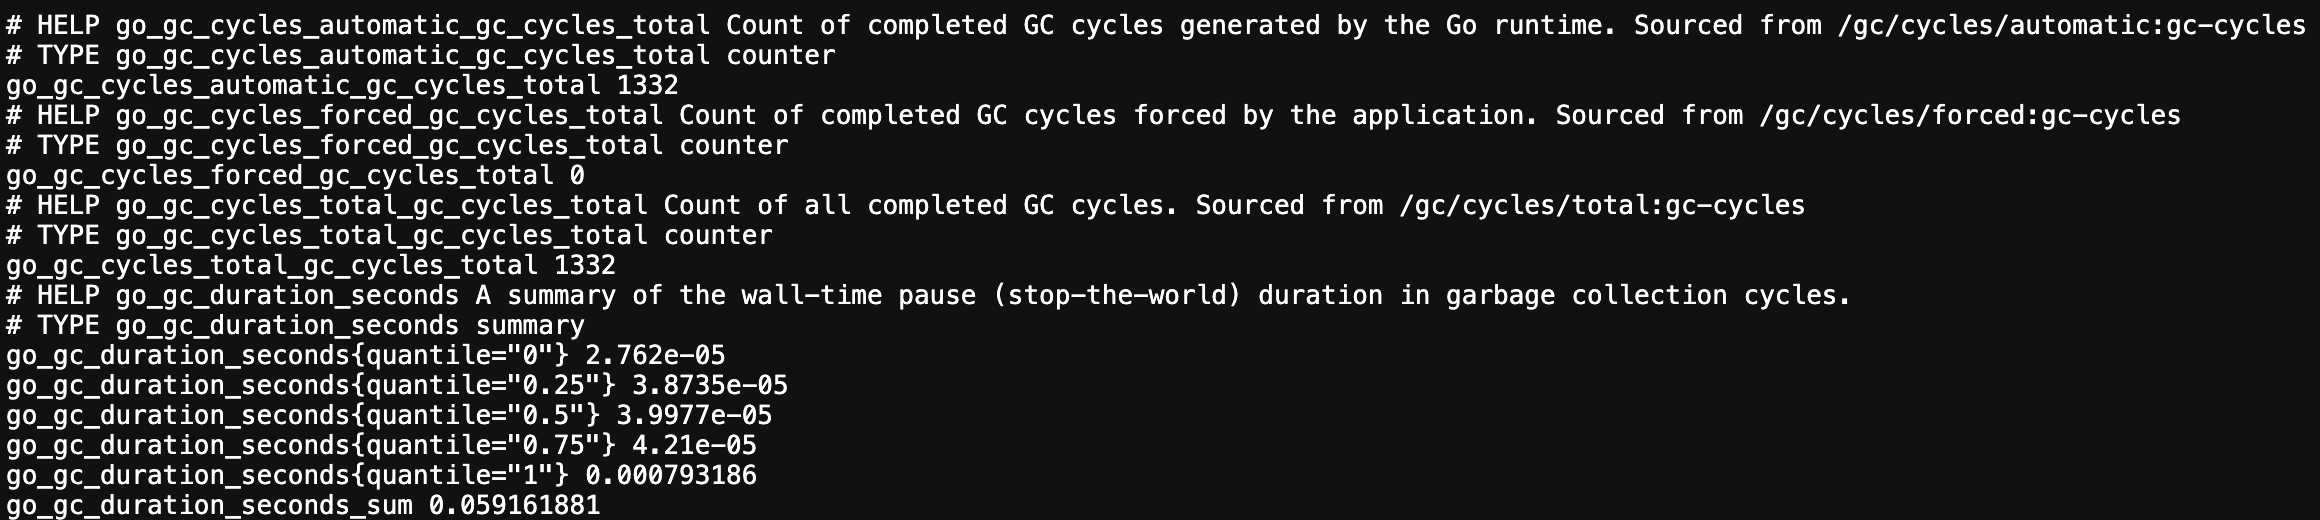
To ensure that Prometheus is capturing the metrics, open a browser tab and navigate to the metrics endpoint URL.
For example, navigate to
http://localhost:9090/metricsYou should see something similar to the following:
Tip: Consult the Prometheus documentation if you are unable to run the Prometheus service or can’t verify that Prometheus is capturing metrics.
page 4 of 7