Important: This documentation is about an older version. It's relevant only to the release noted, many of the features and functions have been updated or replaced. Please view the current version.
Elasticsearch
Using the Elasticsearch k6 extension, you can store k6 metrics in Elasticsearch and analyze your performance results with Kibana or Grafana.
Build the k6 version
To build a k6 binary with the extension, first, make sure you have Go and Git installed on your machine.
Then, open your terminal and run the following commands:
# Install xk6
go install go.k6.io/xk6/cmd/xk6@latest

# Build the k6 binary
xk6 build --with github.com/elastic/xk6-output-elasticsearch

... [INFO] Build environment ready
... [INFO] Building k6
... [INFO] Build complete: ./k6
xk6 will create the new k6 binary in the local folder.
Note
To learn more about how to build custom k6 versions, check out xk6.
Run the test
Check that the Elasticsearch instance to store the k6 metrics is running.
If you’re running on Elasticsearch cloud, use the previous k6 binary and run the test passing the cloud credentials as follows:
# export cloud configuration
export K6_ELASTICSEARCH_CLOUD_ID=your-cloud-id-here
export K6_ELASTICSEARCH_USER=your-user-here
export K6_ELASTICSEARCH_PASSWORD=your-password-here

# run the test
./k6 run script.js -o output-elasticsearch
k6 runs the test script and sends the metrics in real-time to Elasticsearch.
You can also send the metrics to a local Elasticsearch cluster:
# export local url
export K6_ELASTICSEARCH_URL=http://localhost:9200

# run the test
./k6 run script.js -o output-elasticsearch
Caution
Security and self-signed certificates for non-cloud clusters are not yet supported.
You can now connect to Elasticsearch and query the
k6 metrics stored in the k6-metrics index.
The following example uses an unsecured local Elasticsearch, version 7.17.9:
curl -XGET 'http://localhost:9200/k6-metrics/_search?pretty' -H 'Content-Type: application/json' -d'
{
  "sort": [
    {
      "Time": {
        "order": "desc"
      }
    }
  ],
  "size": 10
}'
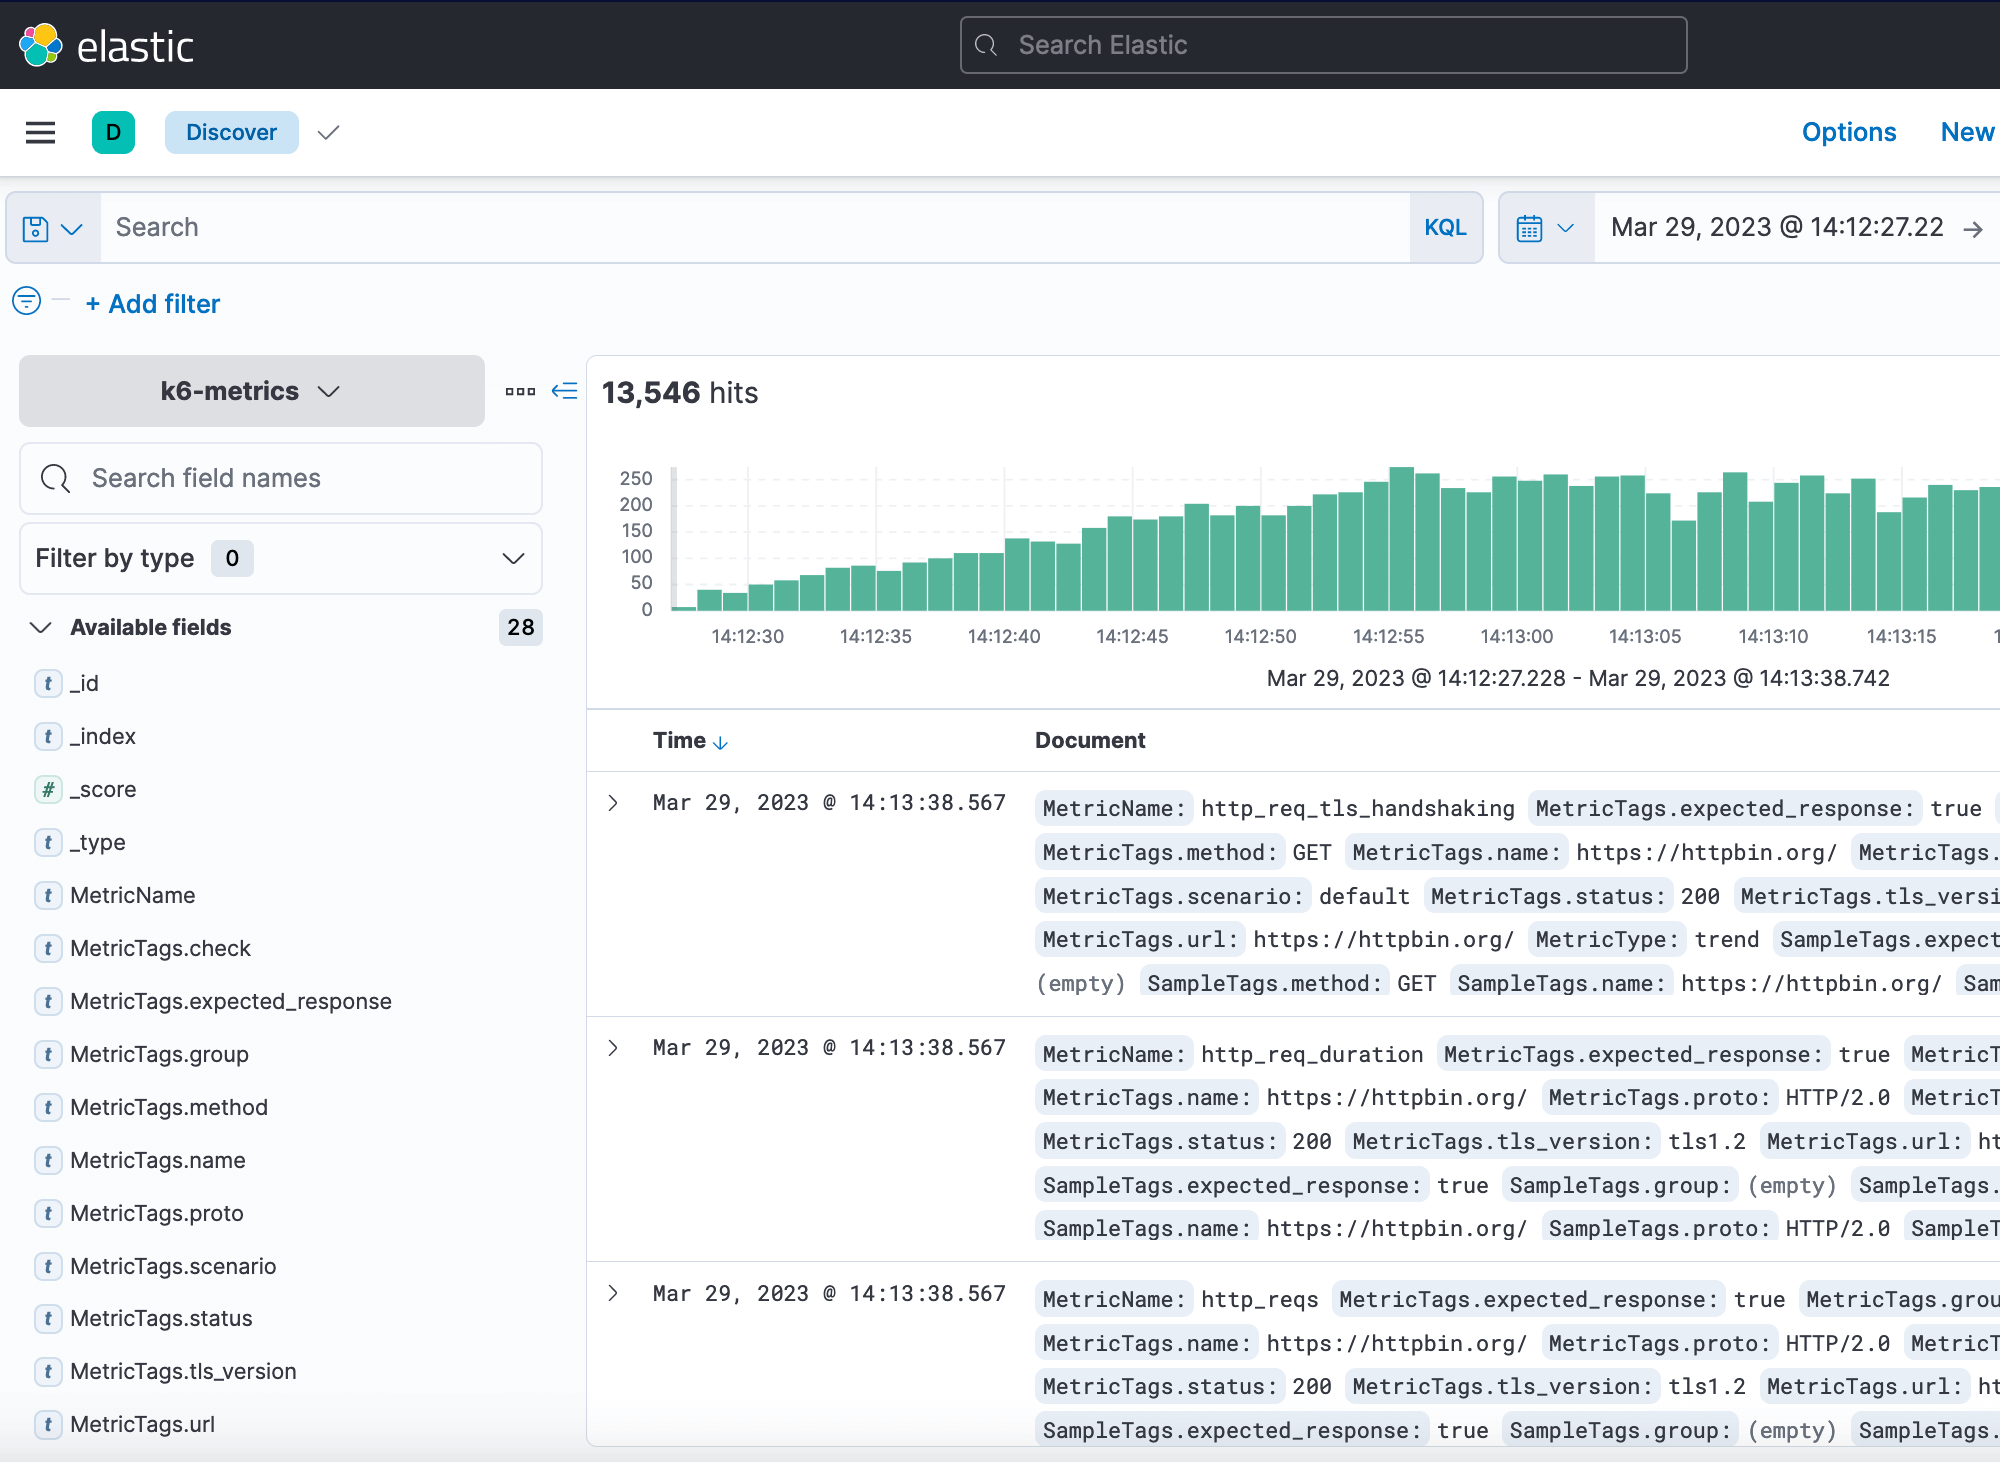
Or use Kibana Discover:

Options
Here is the full list of options that can be configured and passed to the extension:

