Important: This documentation is about an older version. It's relevant only to the release noted, many of the features and functions have been updated or replaced. Please view the current version.
Results output
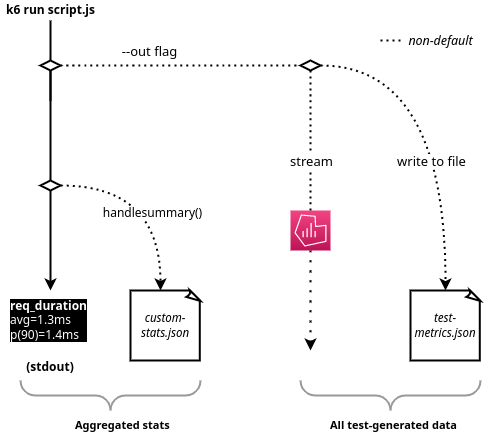
k6 emits metrics with timestamps at every point of the test. You can output the metric results as either aggregated statistics or individual data points.
- For a top-level test overview, use the end-of-test summary.
- For granular output of all metrics (with timestamps), you stream metrics in real time.
If you stream your metrics, you can either write them to a file, like JSON, or stream them to a service, like InfluxDB.


