Important: This documentation is about an older version. It's relevant only to the release noted, many of the features and functions have been updated or replaced. Please view the current version.
What’s New in Grafana v4.0
As usual this release contains a ton of minor new features, fixes and improved UX. But on top of the usual new goodies is a core new feature: Alerting! Read on below for a detailed description of what’s new in v4.0.
Alerting
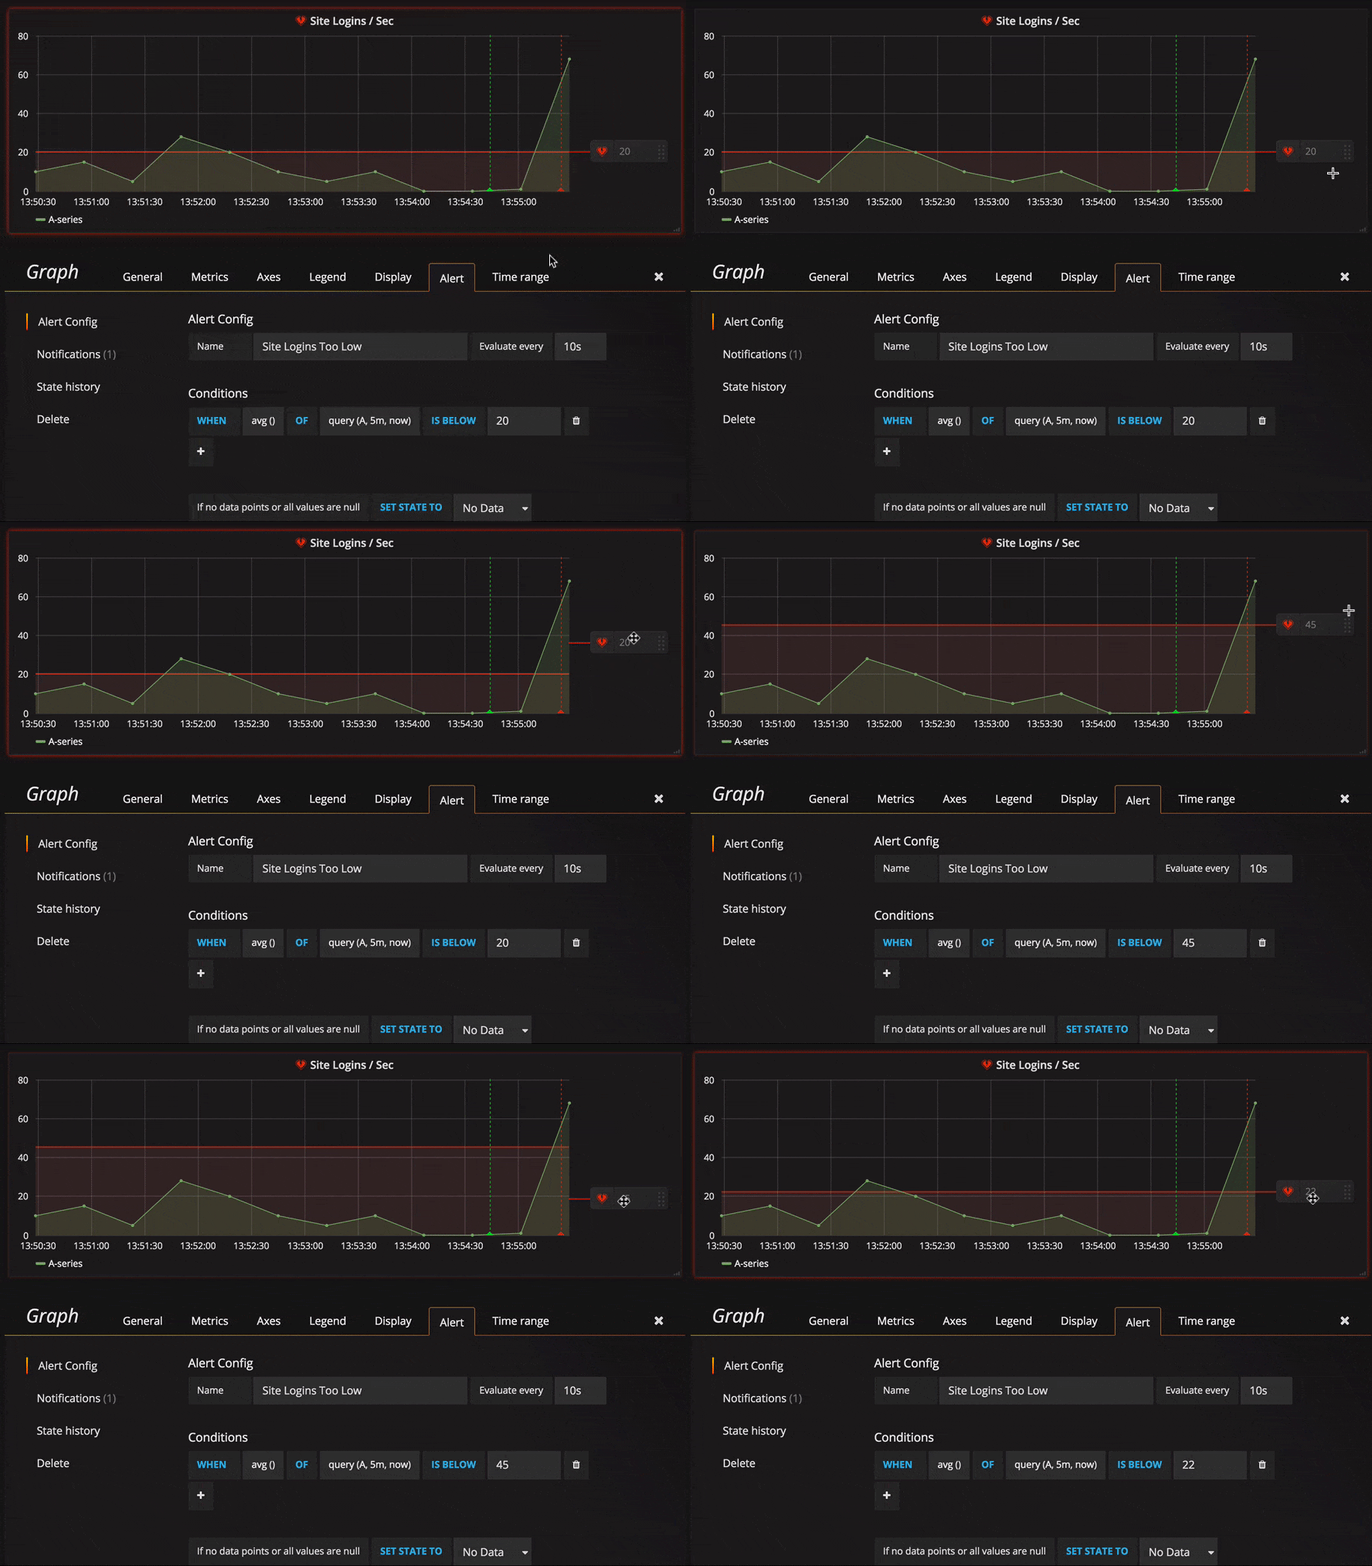
Alerting is a really revolutionary feature for Grafana. It transforms Grafana from a visualization tool into a truly mission critical monitoring tool. The alert rules are very easy to configure using your existing graph panels and threshold levels can be set simply by dragging handles to the right side of the graph. The rules will continually be evaluated by grafana-server and notifications will be sent out when the rule conditions are met.
This feature has been worked on for over a year with many iterations and rewrites just to make sure the foundations are really solid. We are really proud to finally release it! Since the alerting execution is processed in the backend all data source plugins are not supported. Right now Graphite, Prometheus, InfluxDB and OpenTSDB are supported. Elasticsearch is being worked on but will be not ready for v4 release.
Rules
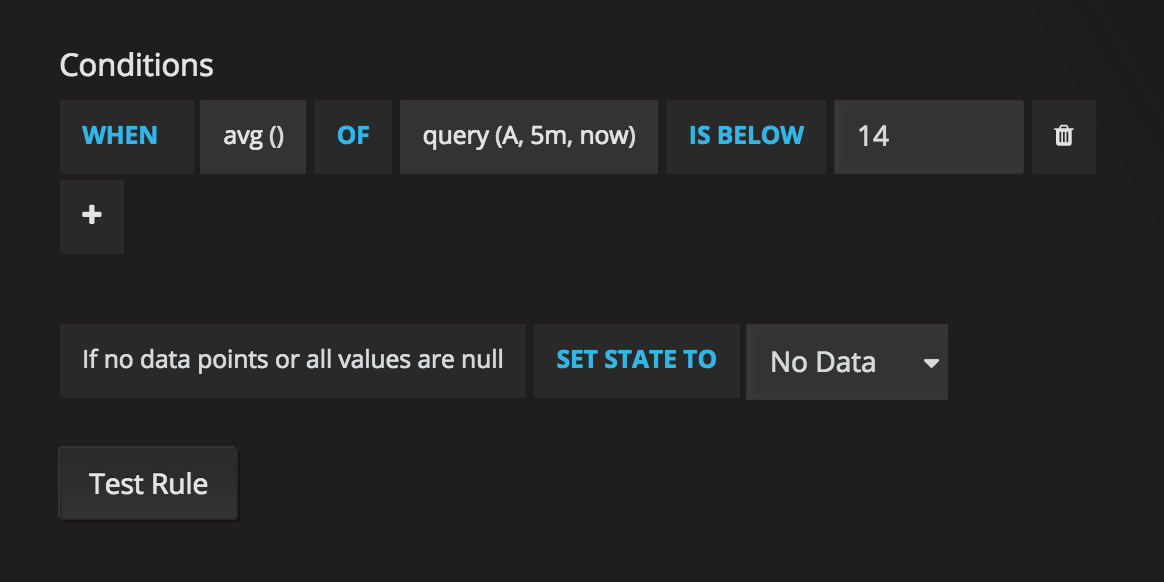
The rule config allows you to specify a name, how often the rule should be evaluated and a series of conditions that all need to be true for the alert to fire.
Currently the only condition type that exists is a Query condition that allows you to
specify a query letter, time range and an aggregation function. The letter refers to
a query you already have added in the Metrics tab. The result from the
query and the aggregation function is a single value that is then used in the threshold check.
We plan to add other condition types in the future, like Other Alert, where you can include the state
of another alert in your conditions, and Time Of Day.
Notifications
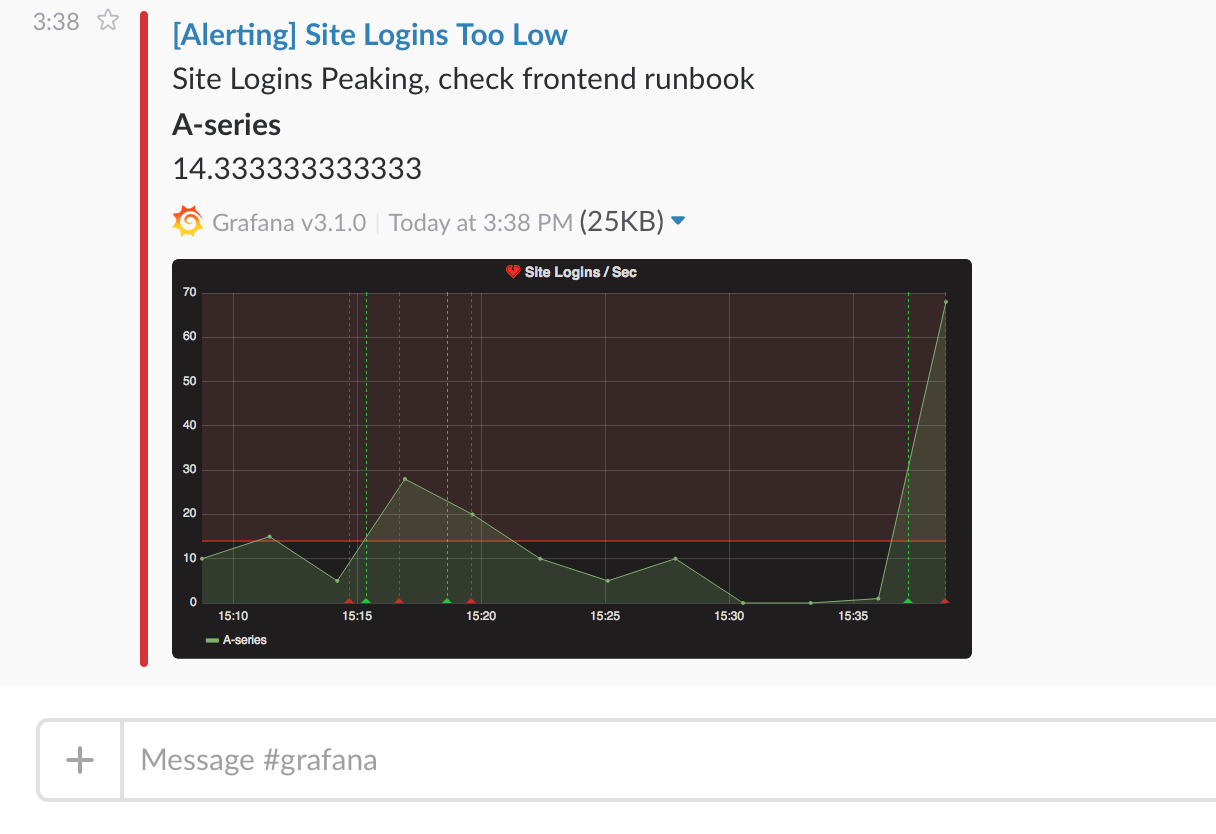
Alerting would not be very useful if there was no way to send notifications when rules trigger and change state. You
can setup notifications of different types. We currently have Slack, PagerDuty, Email and Webhook with more in the
pipe that will be added during beta period. The notifications can then be added to your alert rules.
If you have configured an external image store in the grafana.ini config file (s3 and webdav options available)
you can get very rich notifications with an image of the graph and the metric
values all included in the notification.
Annotations
Alert state changes are recorded in a new annotation store that is built into Grafana. This store currently only supports storing annotations in Grafana’s own internal database (mysql, postgres or sqlite). The Grafana annotation storage is currently only used for alert state changes but we hope to add the ability for users to add graph comments in the form of annotations directly from within Grafana in a future release.
Alert List Panel
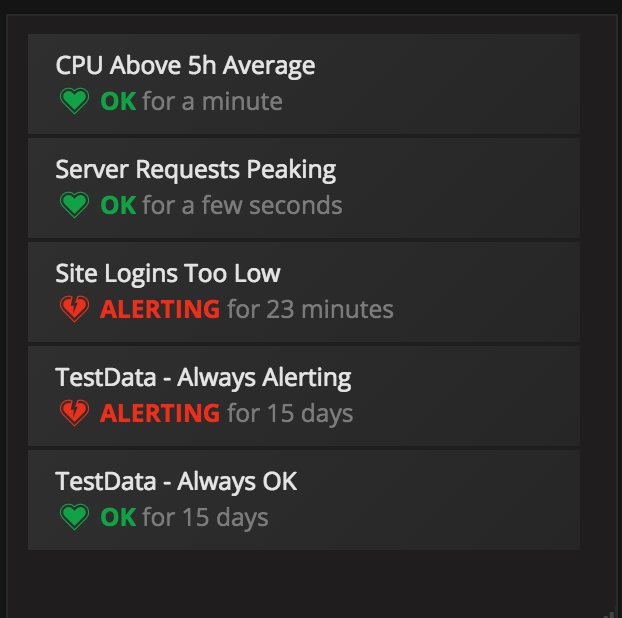
This new panel allows you to show alert rules or a history of alert rule state changes. You can filter based on states your interested in. Very useful panel for overview style dashboards.
Ad-hoc filter variable
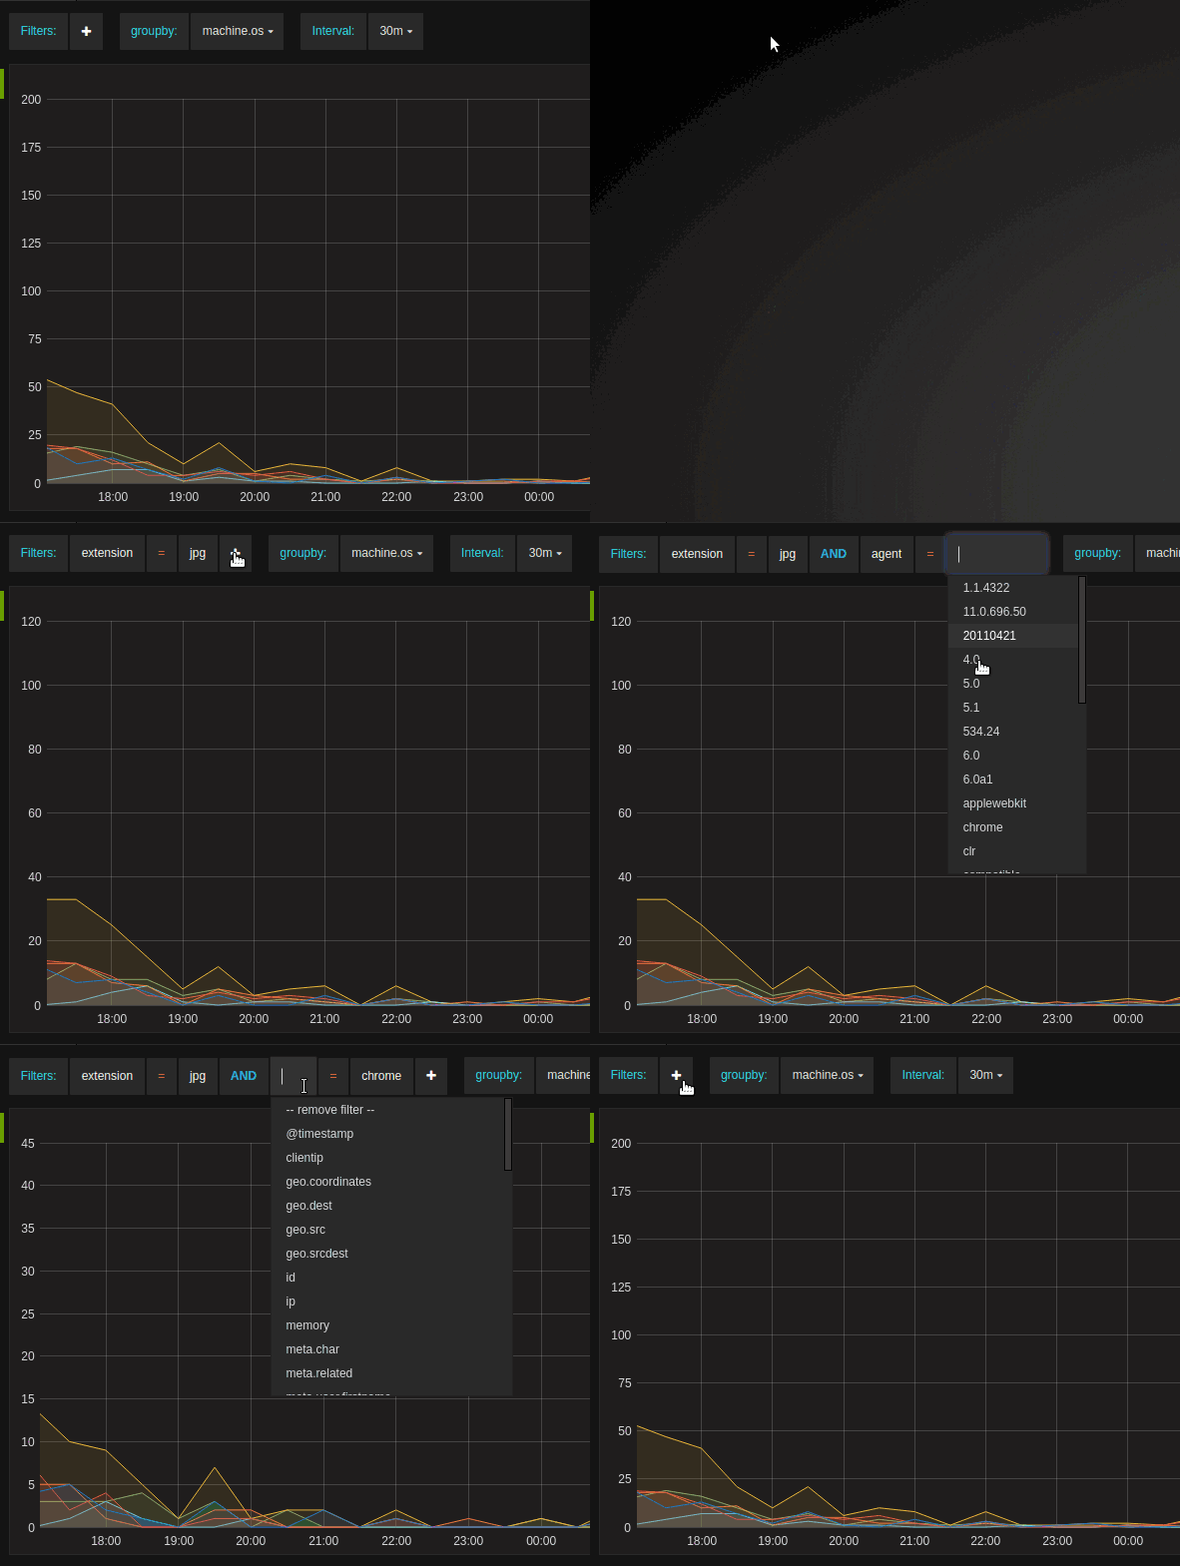
This is a new and very different type of template variable. It will allow you to create new key/value filters on the fly.
With autocomplete for both key and values. The filter condition will be automatically applied to all
queries that use that data source. This feature opens up more exploratory dashboards. In the gif animation to the right
you have a dashboard for Elasticsearch log data. It uses one query variable that allow you to quickly change how the data
is grouped, and an interval variable for controlling the granularity of the time buckets. What was missing
was a way to dynamically apply filters to the log query. With the Ad-Hoc Filters variable you can
dynamically add filters to any log property!
UX Improvements
We always try to bring some UX/UI refinements & polish in every release.
TV-mode & Kiosk mode
Grafana is so often used on wall mounted TVs that we figured a clean TV mode would be really nice. In TV mode the top navbar, row & panel controls will all fade to transparent.
<p>
  This happens automatically after one minute of user inactivity but can also be toggled manually
  with the <code>d v</code> sequence shortcut. Any mouse movement or keyboard action will
  restore navbar & controls.
</p>

<p>
  Another feature is the kiosk mode. This can be enabled with <code>d k</code>
  shortcut or by adding <code>&kiosk</code> to the URL when you load a dashboard.
  In kiosk mode the navbar is completely hidden/removed from view.
</p>
New row menu & add panel experience

We spent a lot of time improving the dashboard building experience. Trying to make it both
more efficient and easier for beginners. After many good but not great experiments
with a build mode we eventually decided to just improve the green row menu and
continue work on a build mode for a future release.
The new row menu automatically slides out when you mouse over the edge of the row. You no longer need to hover over the small green icon and the click it to expand the row menu.
There is some minor improvements to drag and drop behaviour. Now when dragging a panel from one row to another you will insert the panel and Grafana will automatically make room for it. When you drag a panel within a row you will simply reorder the panels.
If you look at the animation to the right you can see that you can drag and drop a new panel. This is not required, you can also just click the panel type and it will be inserted at the end of the row automatically. Dragging a new panel has an advantage in that you can insert a new panel where ever you want not just at the end of the row.
We plan to further improve dashboard building in the future with a more rich grid & layout system.
Keyboard shortcuts
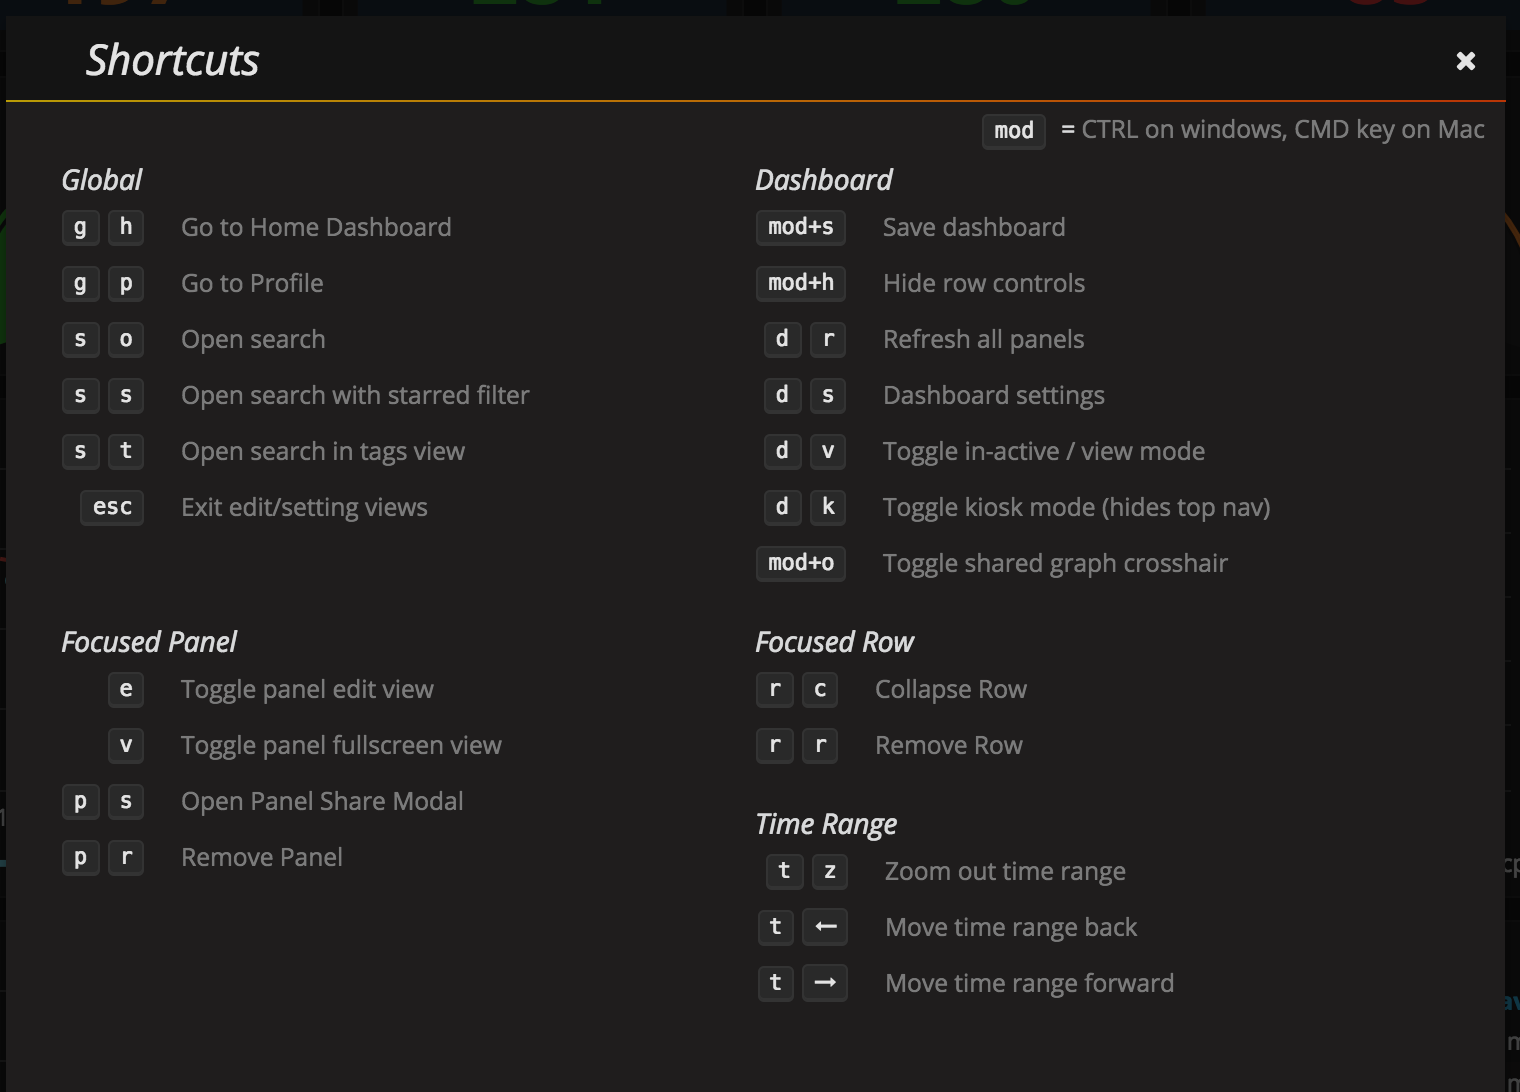
Grafana v4 introduces a number of really powerful keyboard shortcuts. You can now focus a panel
by hovering over it with your mouse. With a panel focused you can simple hit e to toggle panel
edit mode, or v to toggle fullscreen mode. p r removes the panel. p s opens share
modal.
Some nice navigation shortcuts are:
g hfor go to home dashboards sopen search with starred pre-selecteds topen search in tags list view
Upgrade & Breaking changes
There are no breaking changes. Old dashboards and features should work the same. Grafana-server will automatically upgrade it’s db schema on restart. It’s advisable to do a backup of Grafana’s database before updating.
If your are using plugins make sure to update your plugins as some might not work perfectly v4.
You can update plugins using grafana-cli
grafana-cli plugins update-all
Changelog
Checkout the CHANGELOG.md file for a complete list of new features, changes, and bug fixes.

