Important: This documentation is about an older version. It's relevant only to the release noted, many of the features and functions have been updated or replaced. Please view the current version.
Alert rules
An alert rule is a set of evaluation criteria for when an alert rule should fire. An alert rule consists of:
- Queries and expressions that select the data set to evaluate.
- A condition (the threshold) that the query must meet or exceed to trigger the alert instance.
- An interval that specifies the frequency of alert rule evaluation and a duration indicating how long the condition must be met to trigger the alert instance.
- Other customizable options, for example, setting what should happen in the absence of data, notification messages, and more.
Grafana supports two different alert rule types: Grafana-managed alert rules and data source-managed alert rules.
Grafana-managed alert rules
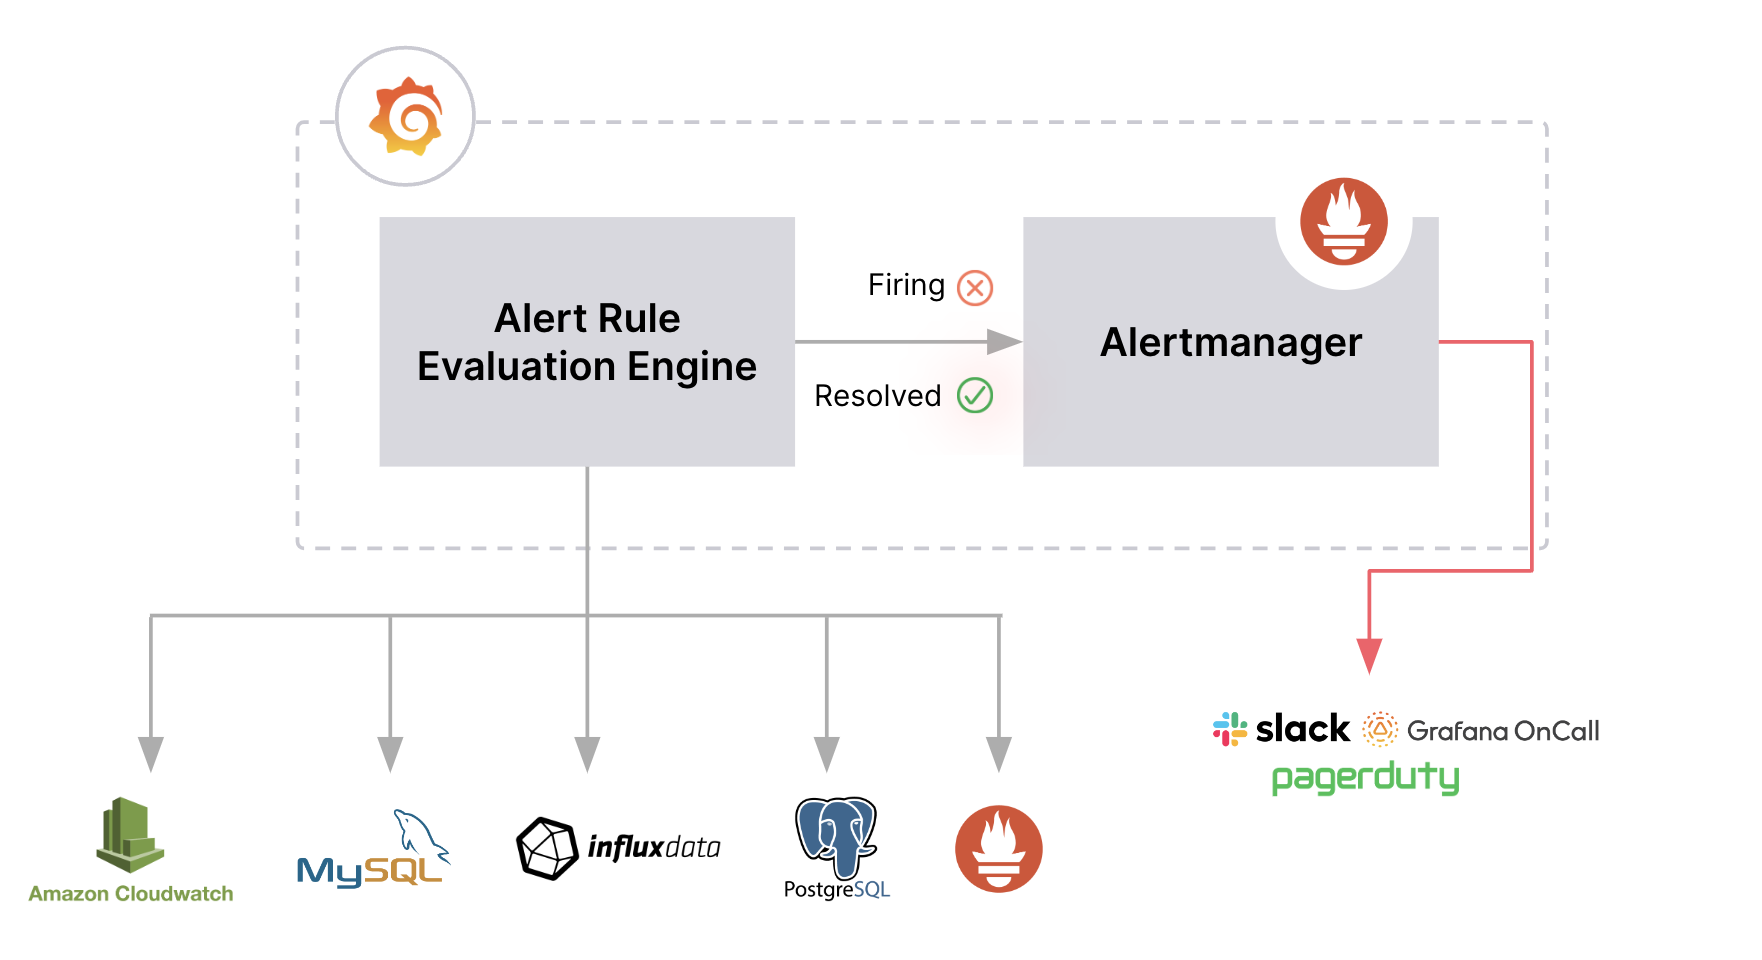
Grafana-managed alert rules are the most flexible alert rule type. They allow you to create alert rules that can act on data from any of the supported data sources, and use multiple data sources in a single alert rule.

- Alert rules are created within Grafana and query one or more data sources.
- Alert rules are evaluated by the Alert Rule Evaluation Engine from within Grafana.
- Firing and resolved alert instances are forwarded to handle their notifications.
Supported data sources
Grafana-managed alert rules can query backend data sources if Grafana Alerting is enabled by specifying {"backend": true, "alerting": true} in the plugin.json file.
Find the public data sources supporting Alerting in the Grafana Plugins directory.
Data source-managed alert rules
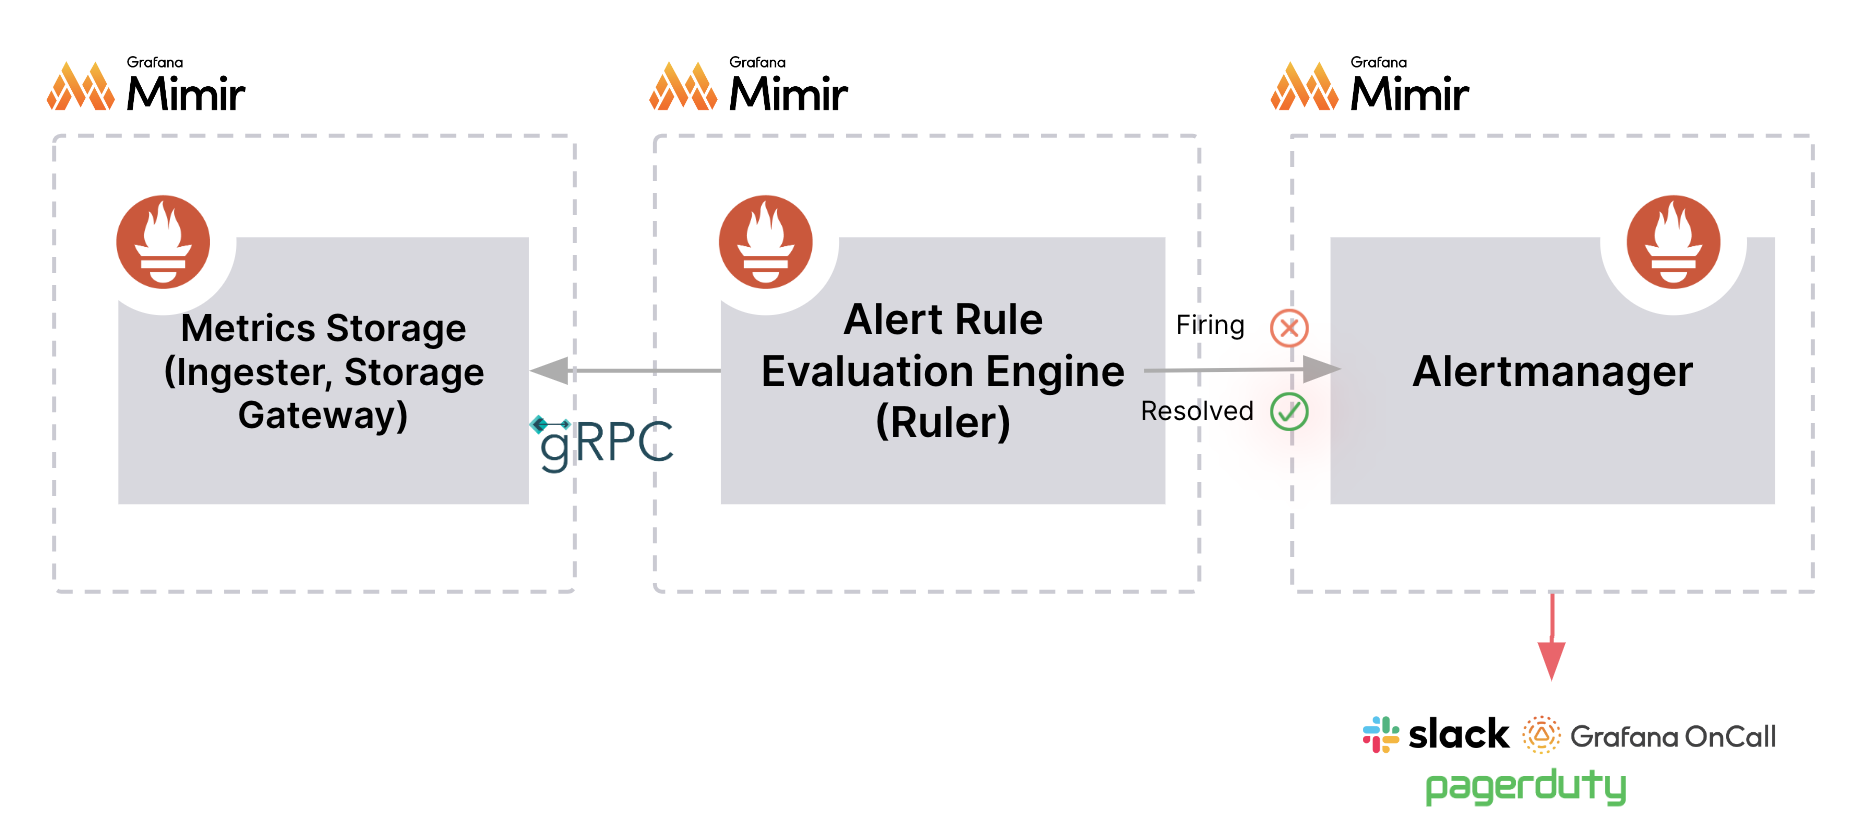
Data source-managed alert rules can query Prometheus-based data sources, such as Grafana Mimir or Grafana Loki. Alert rules are stored within the data source when the Ruler API is enabled (e.g., Mimir Ruler API or Loki Ruler API).
In this setup, the distributed architecture can provide high-availability and fault tolerance.

- Alert rules are created and stored within the data source itself.
- Alert rules can only query Prometheus-based data.
- Alert rules are evaluated by the Alert Rule Evaluation Engine.
- Firing and resolved alert instances are forwarded to handle their notifications.
Recording rules
A recording rule pre-compute frequently used or computationally expensive queries, and saves the results as a new time series metric.
The new metric can then be used in alert rules and dashboards to optimize their queries.
Similar to alert rules, recording rules are evaluated periodically. For more details, refer to Create recording rules.
Comparison between alert rule types
When choosing which alert rule type to use, consider the following comparison between Grafana-managed and data source-managed alert rules.


