Cassandra
Cassandra exporter is a standalone application which exports Apache Cassandra® metrics throught a prometheus friendly endpoint. This project is originally a fork of JMX exporter but aims at an easier integration with Apache Cassandra®.
Specifically, this project brings :
- Exporting EstimatedHistogram metrics specific to Apache Cassandra®
- Filtering on mbean's attributes
- Metrics naming that respect the mbean hierarchy
- Comprehensive config file
An essential design choice the project makes is to not let prometheus drive the scraping frequency. This decision has been taken because a lot of Apache Cassandra® metrics are expensive to scrap and can hinder the performance of the node. As we don't want this kind of situation to happen in production, the scrape frequency is restricted via the configuration of Cassandra Exporter.
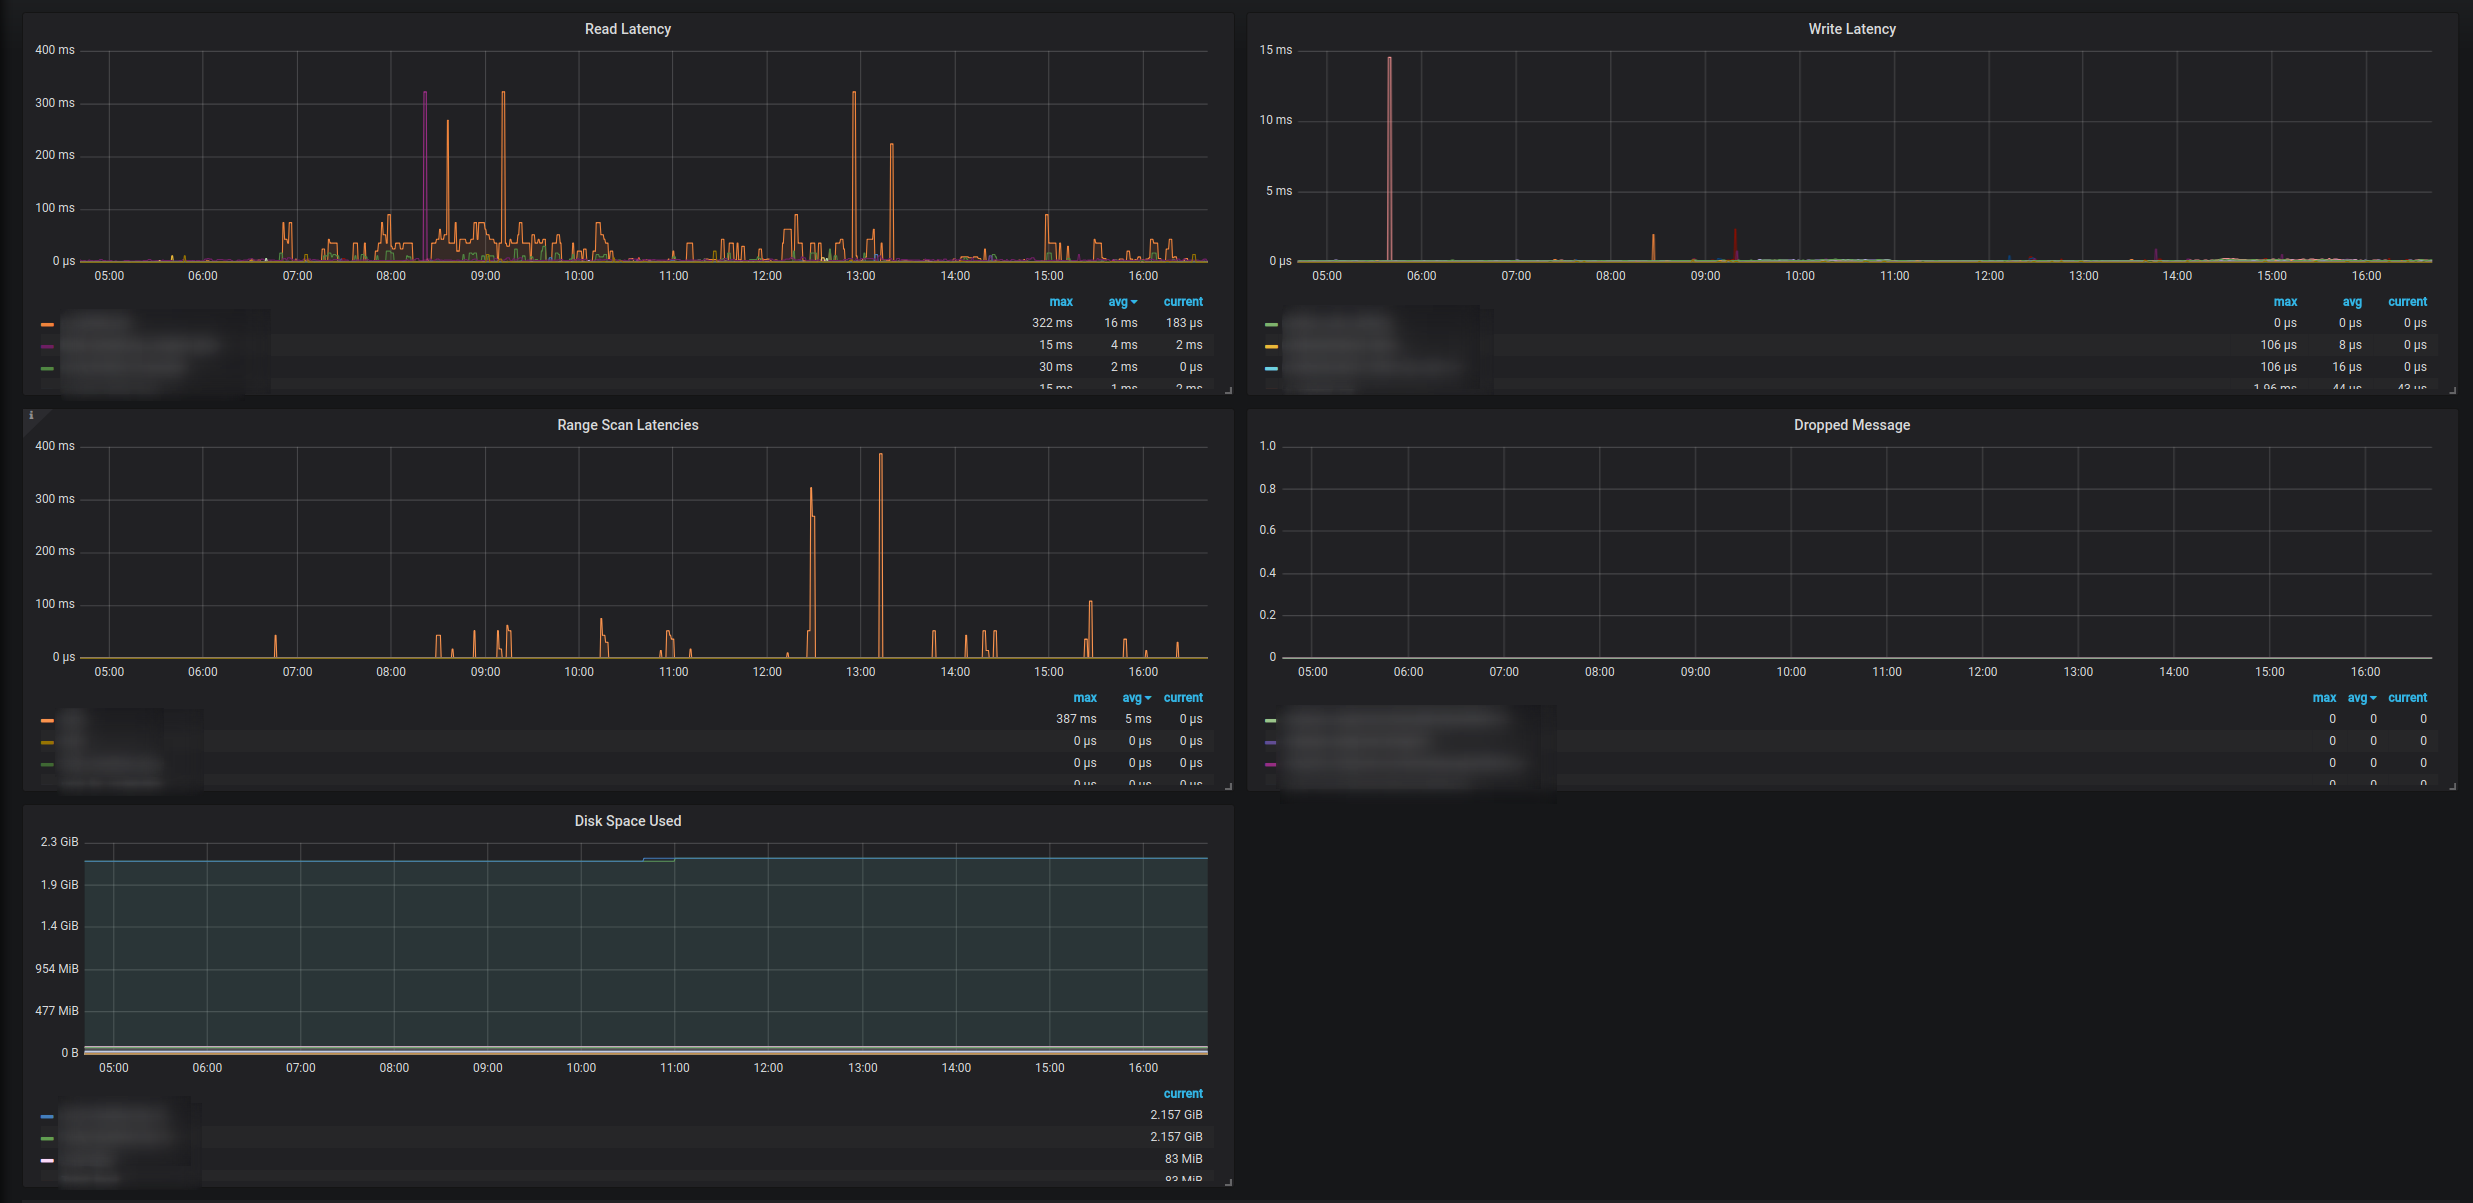
This Dashboard version is made for Cassandra running on top of Kubernetes. You can have a look at MySocialApp helm chart to get a Cassandra managed by Kubernetes and get this dashboard running quickly.
Data source config
Collector config:
Upload an updated version of an exported dashboard.json file from Grafana
| Revision | Description | Created | |
|---|---|---|---|
| Download |
Apache Cassandra
Easily monitor Apache Cassandra, the popular open source NoSQL distributed database, with Grafana Cloud's out-of-the-box monitoring solution.
Learn more
