Telegraf sysstats
System stats retrieved by Telegraf
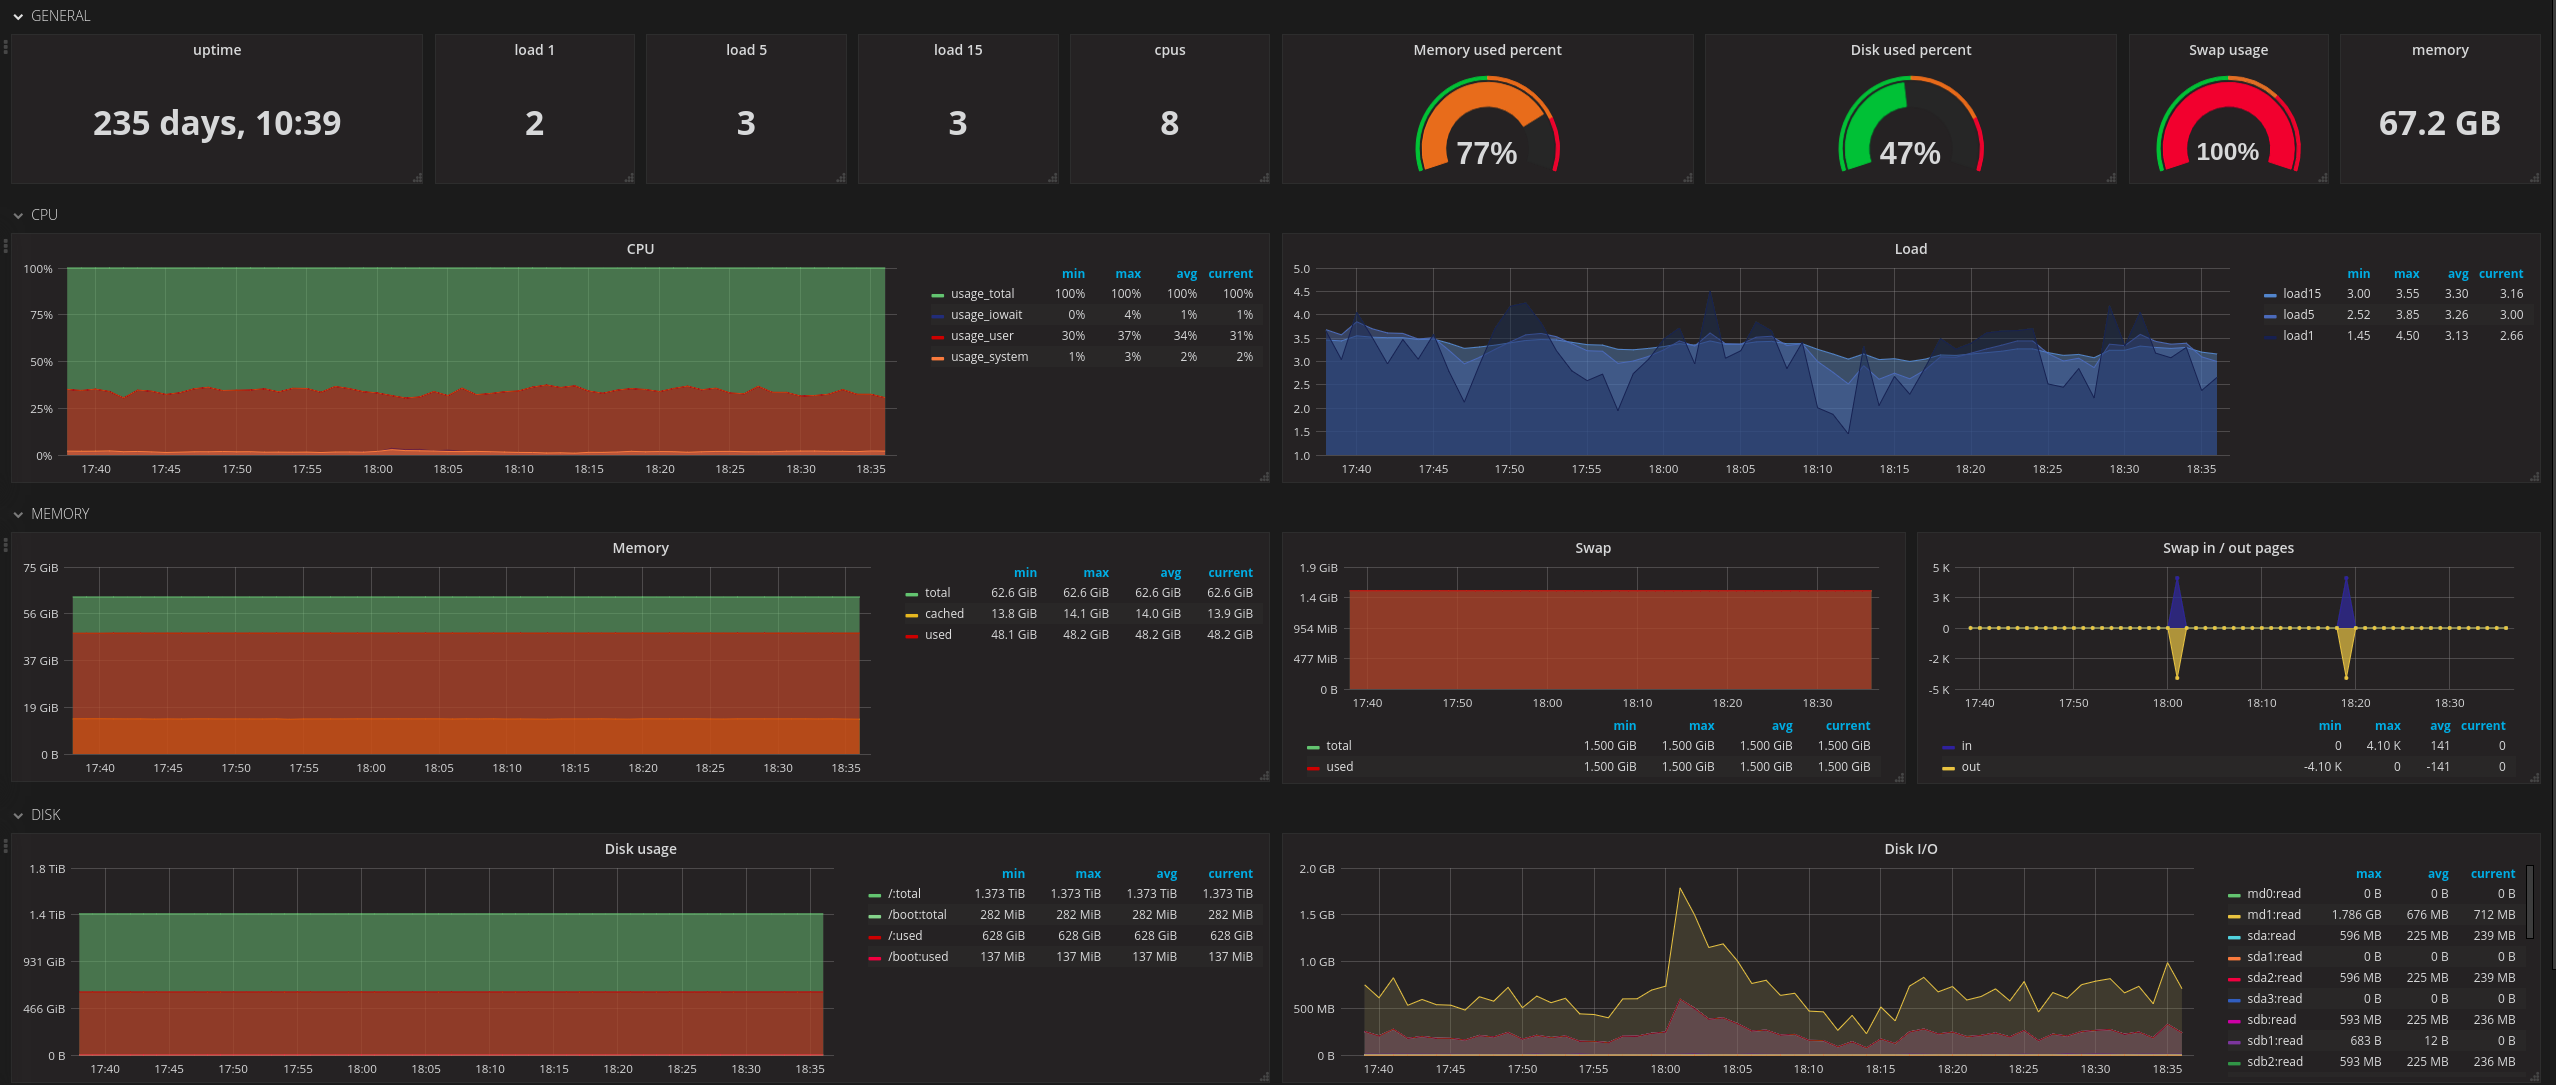
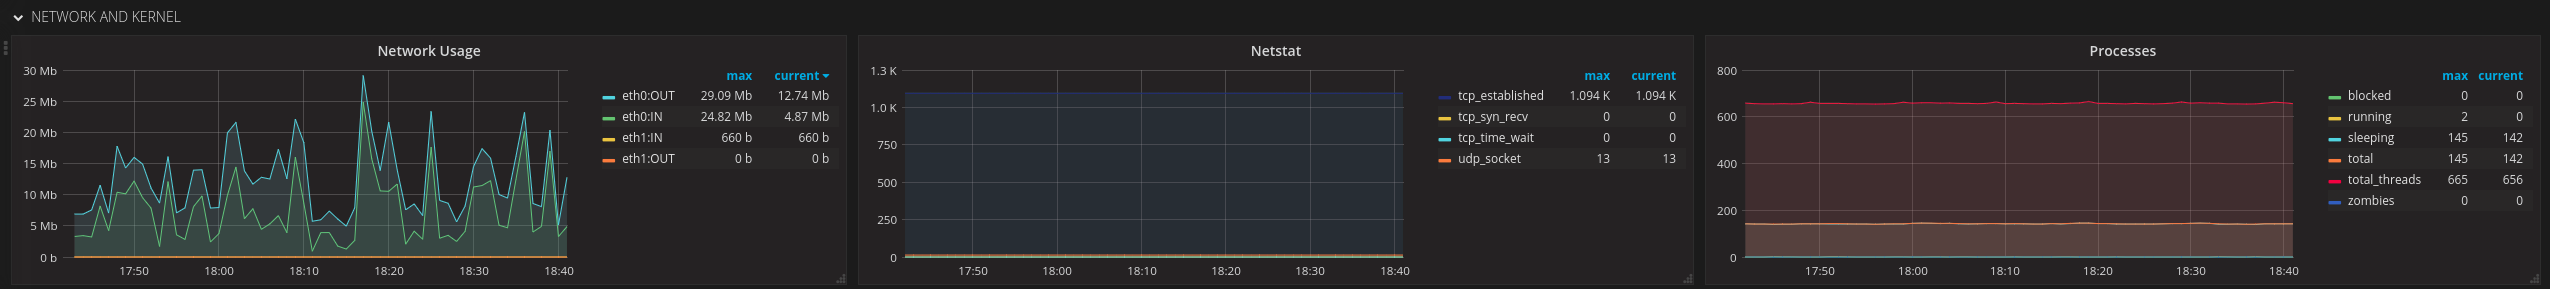
Dashboard presenting system statistics retrieved by Telegraf (CPU, Memory, Swap, Disk and Network usage)
Data source config
Collector type:
Collector plugins:
Collector config:
Revisions
Upload an updated version of an exported dashboard.json file from Grafana
| Revision | Description | Created | |
|---|---|---|---|
| Download |