Ambassador Edge Stack
Ambassador Edge Stack dashboard for Prometheus
Monitoring dashboard for Ambassador Edge Stack and Emissary-ingress
Get started: https://www.getambassador.io/user-guide/monitoring/
Revision 6
Added visualizations for Ambassador Edge Stack WAF. Thanks @AliceProxy!
Revision 5
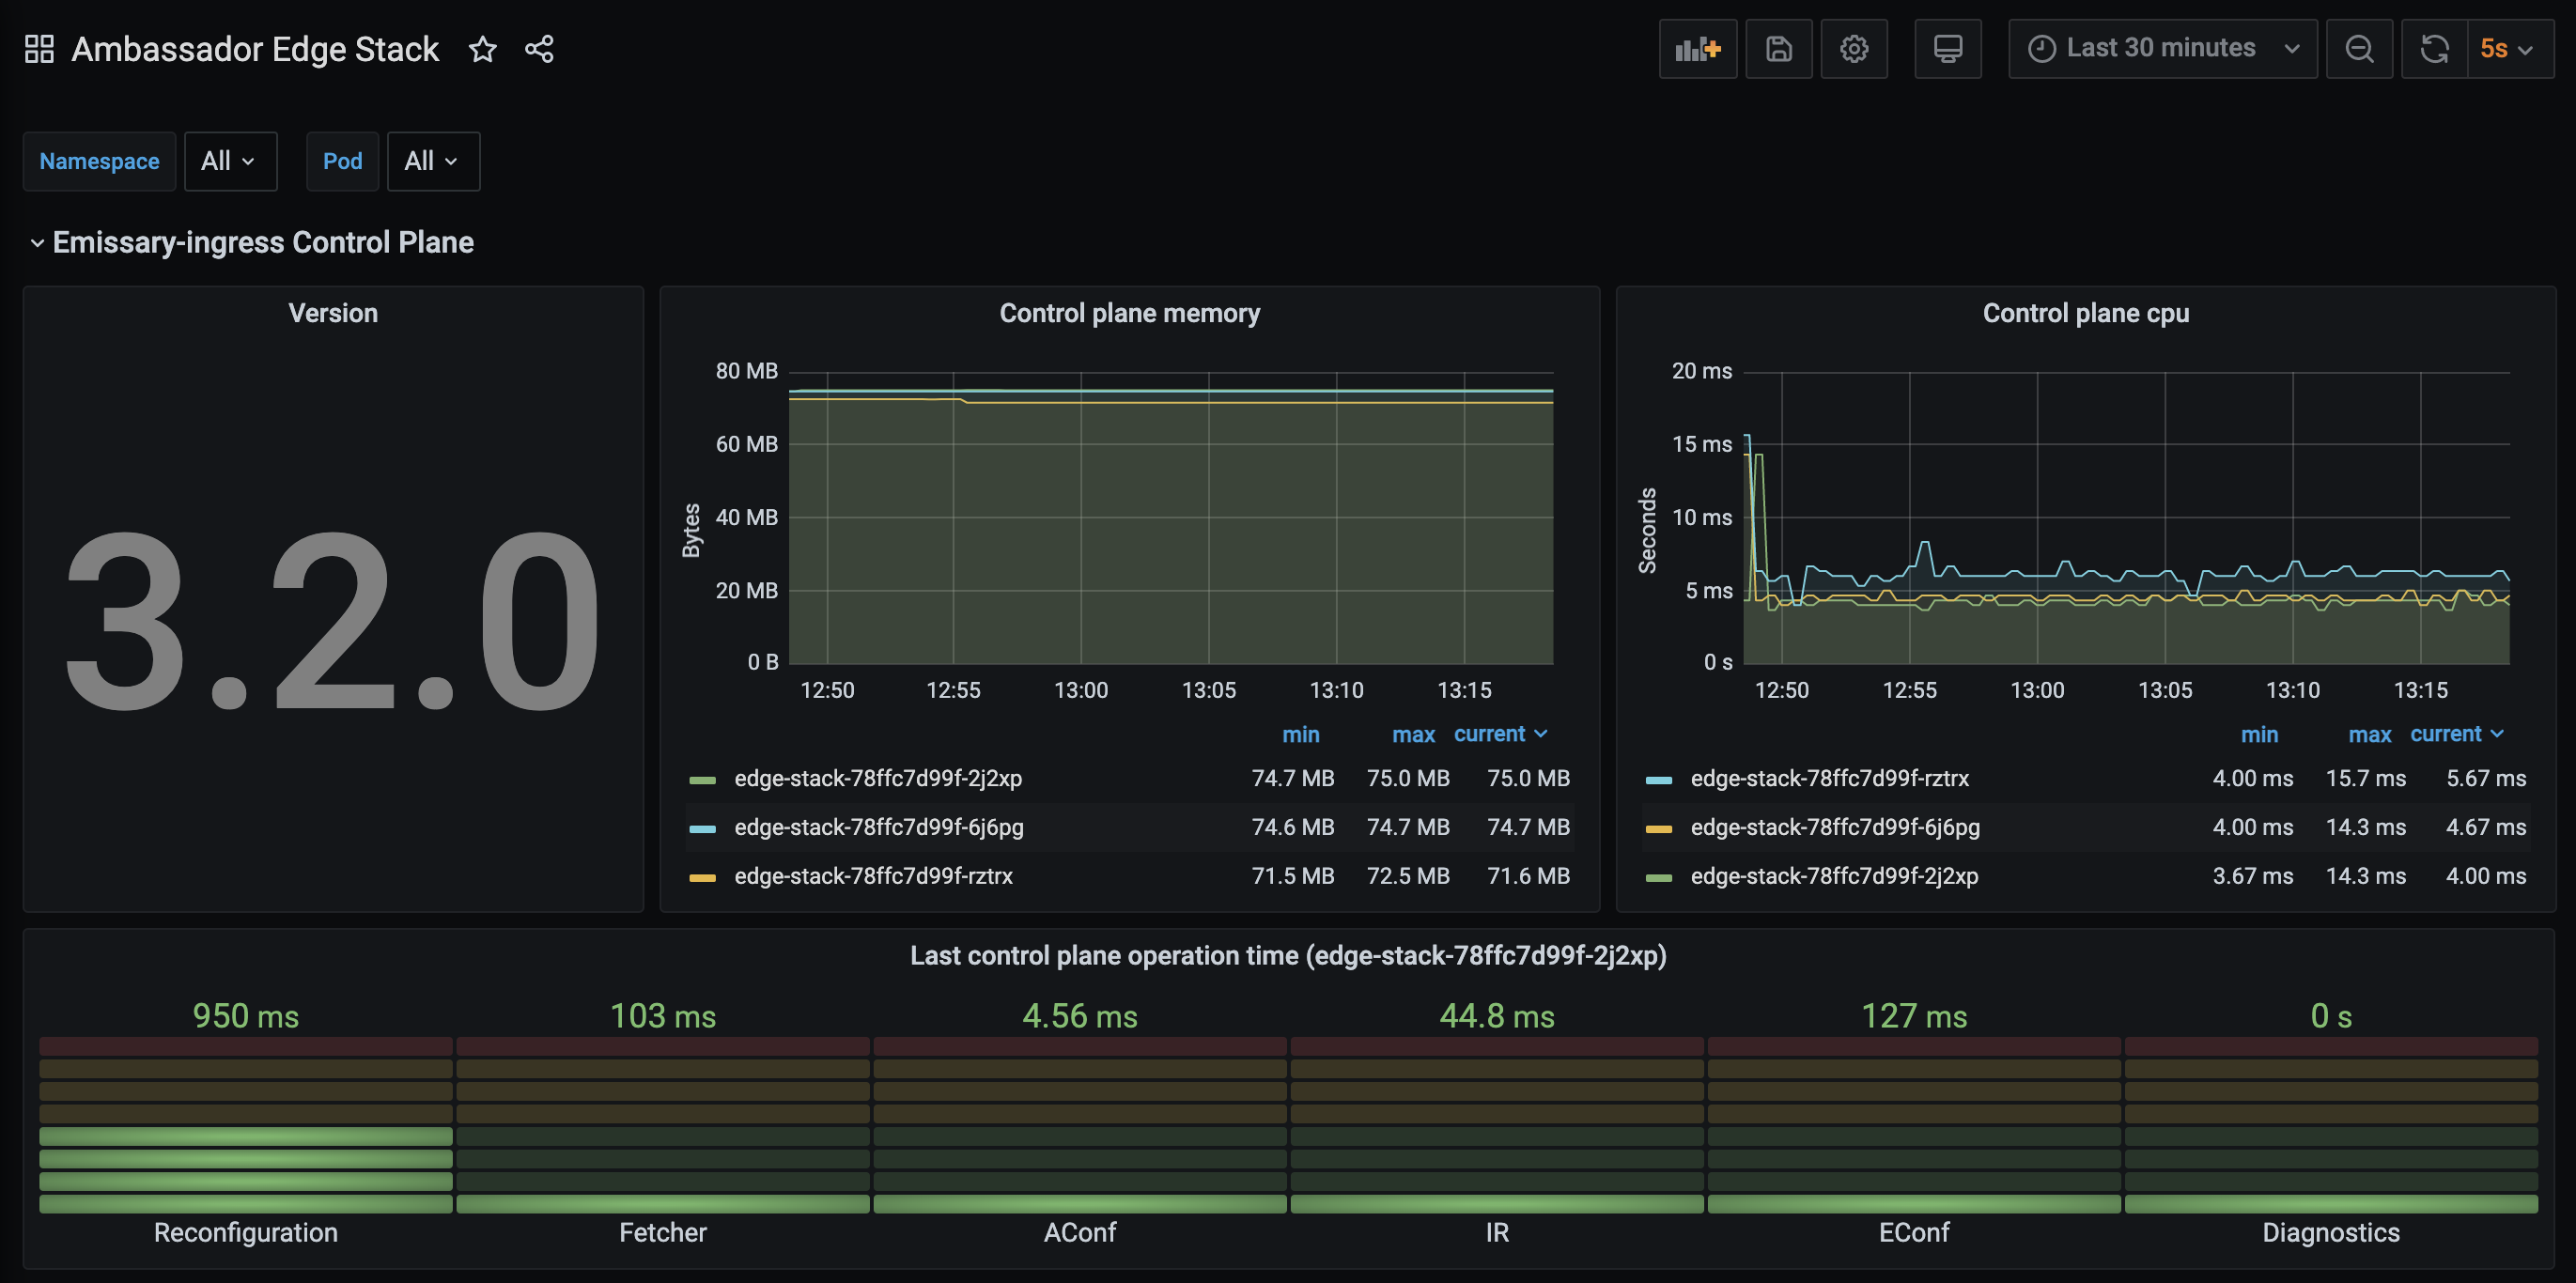
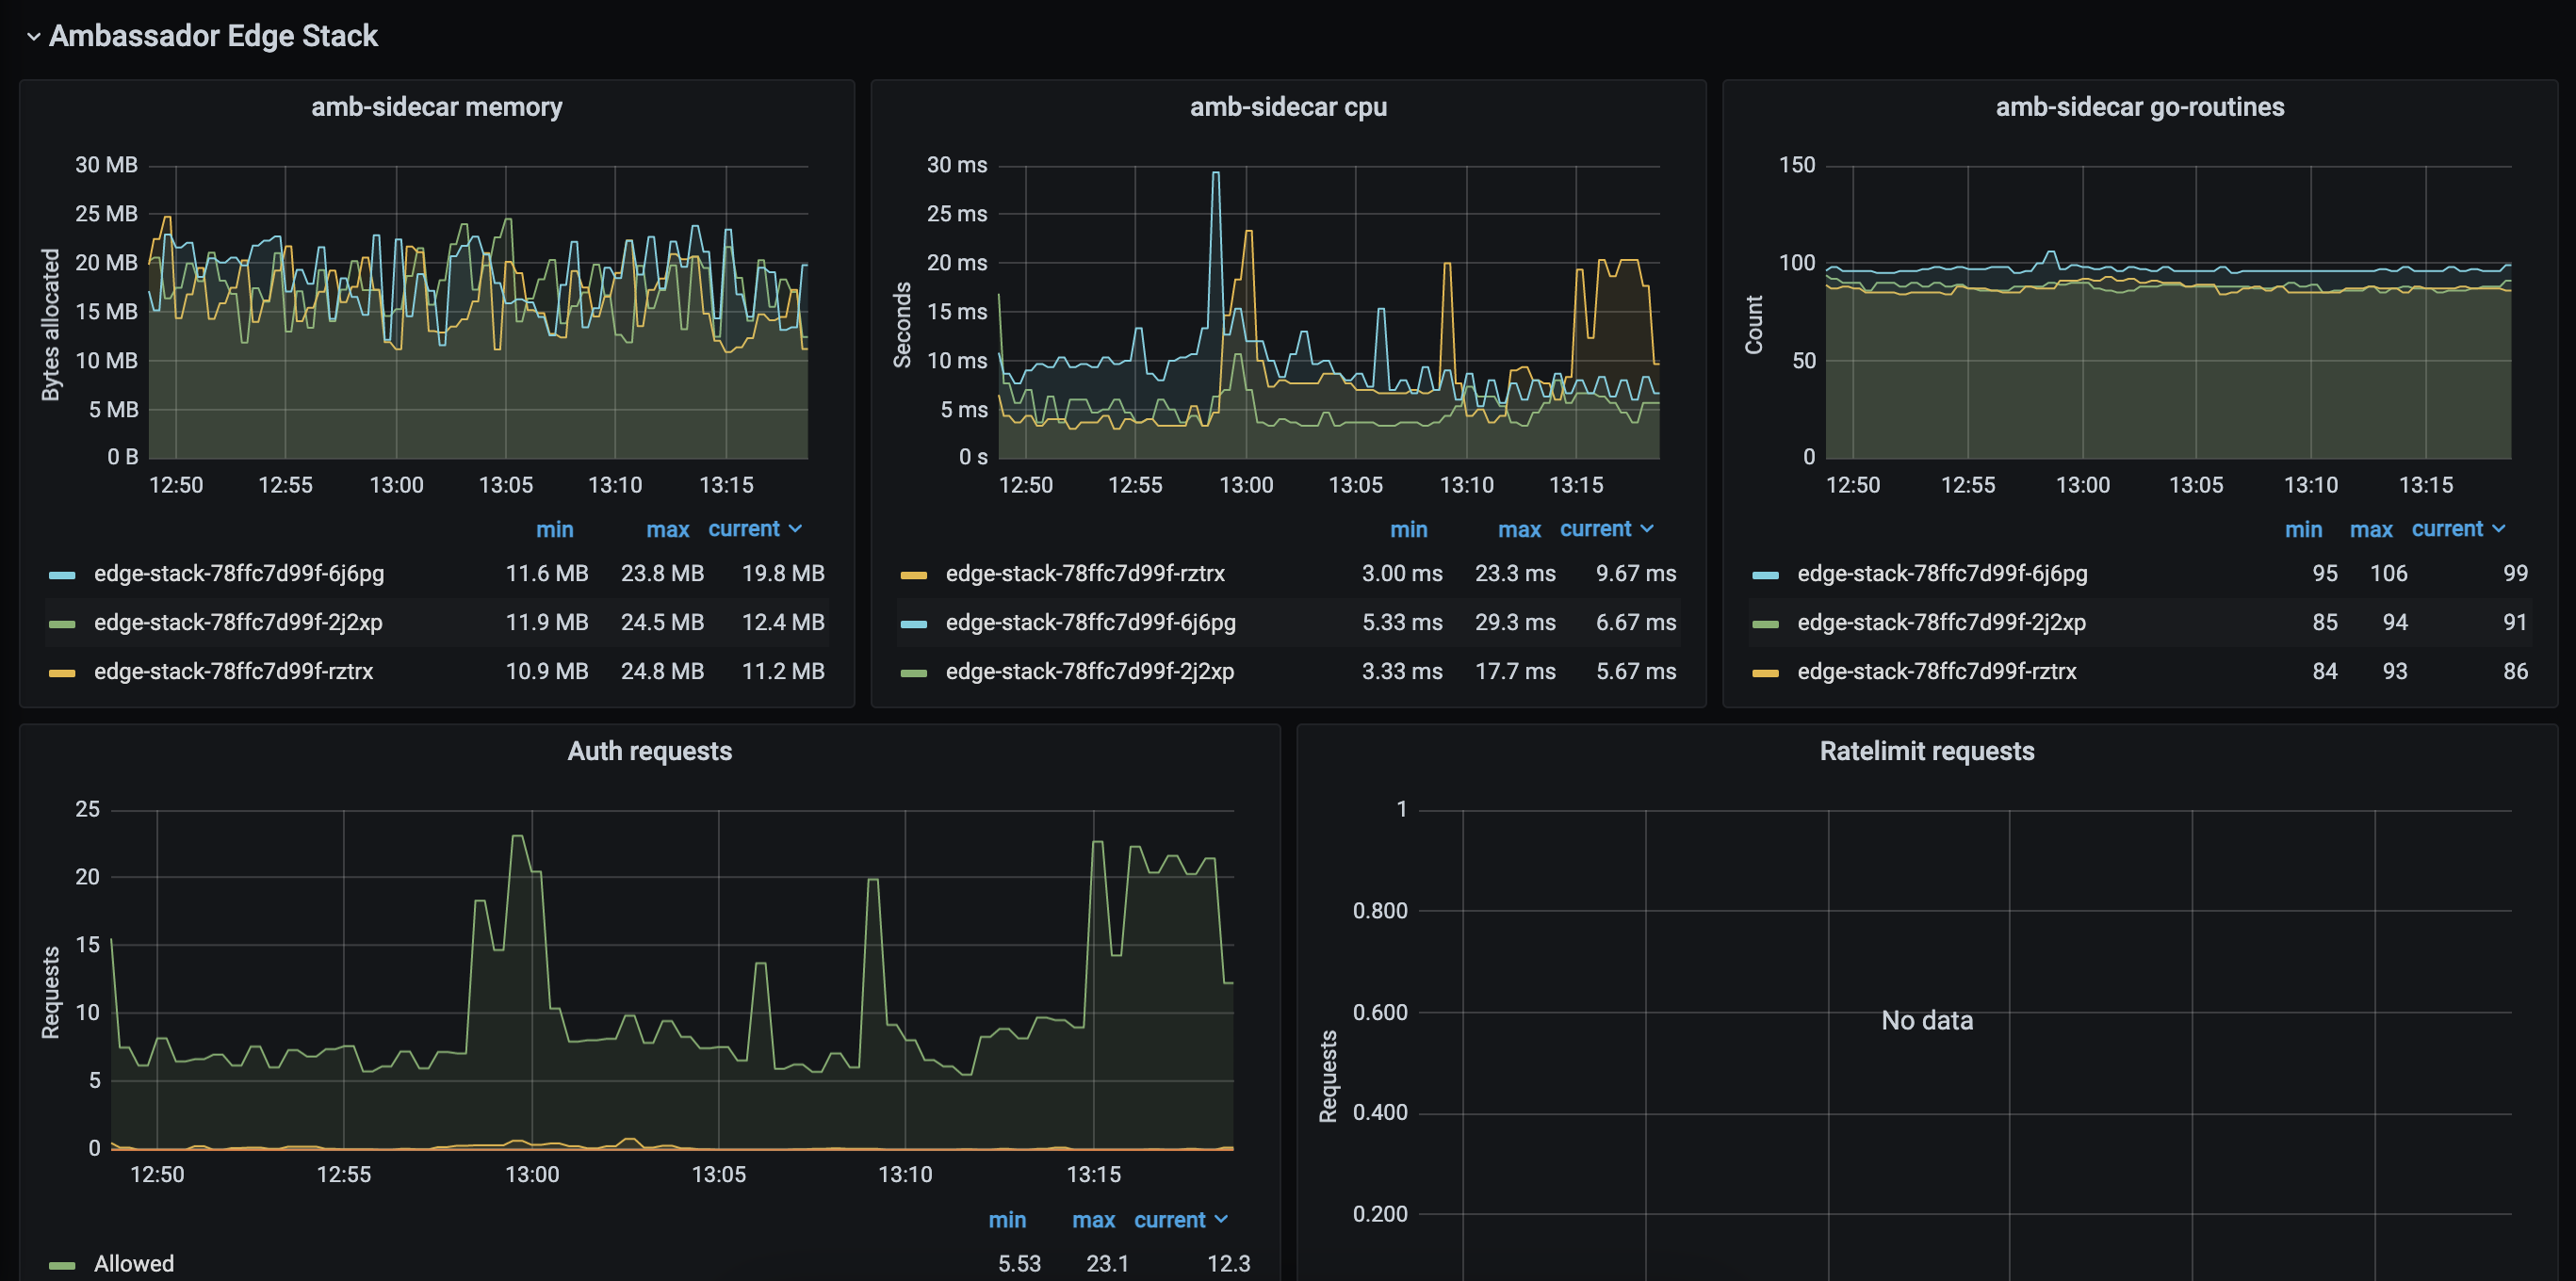
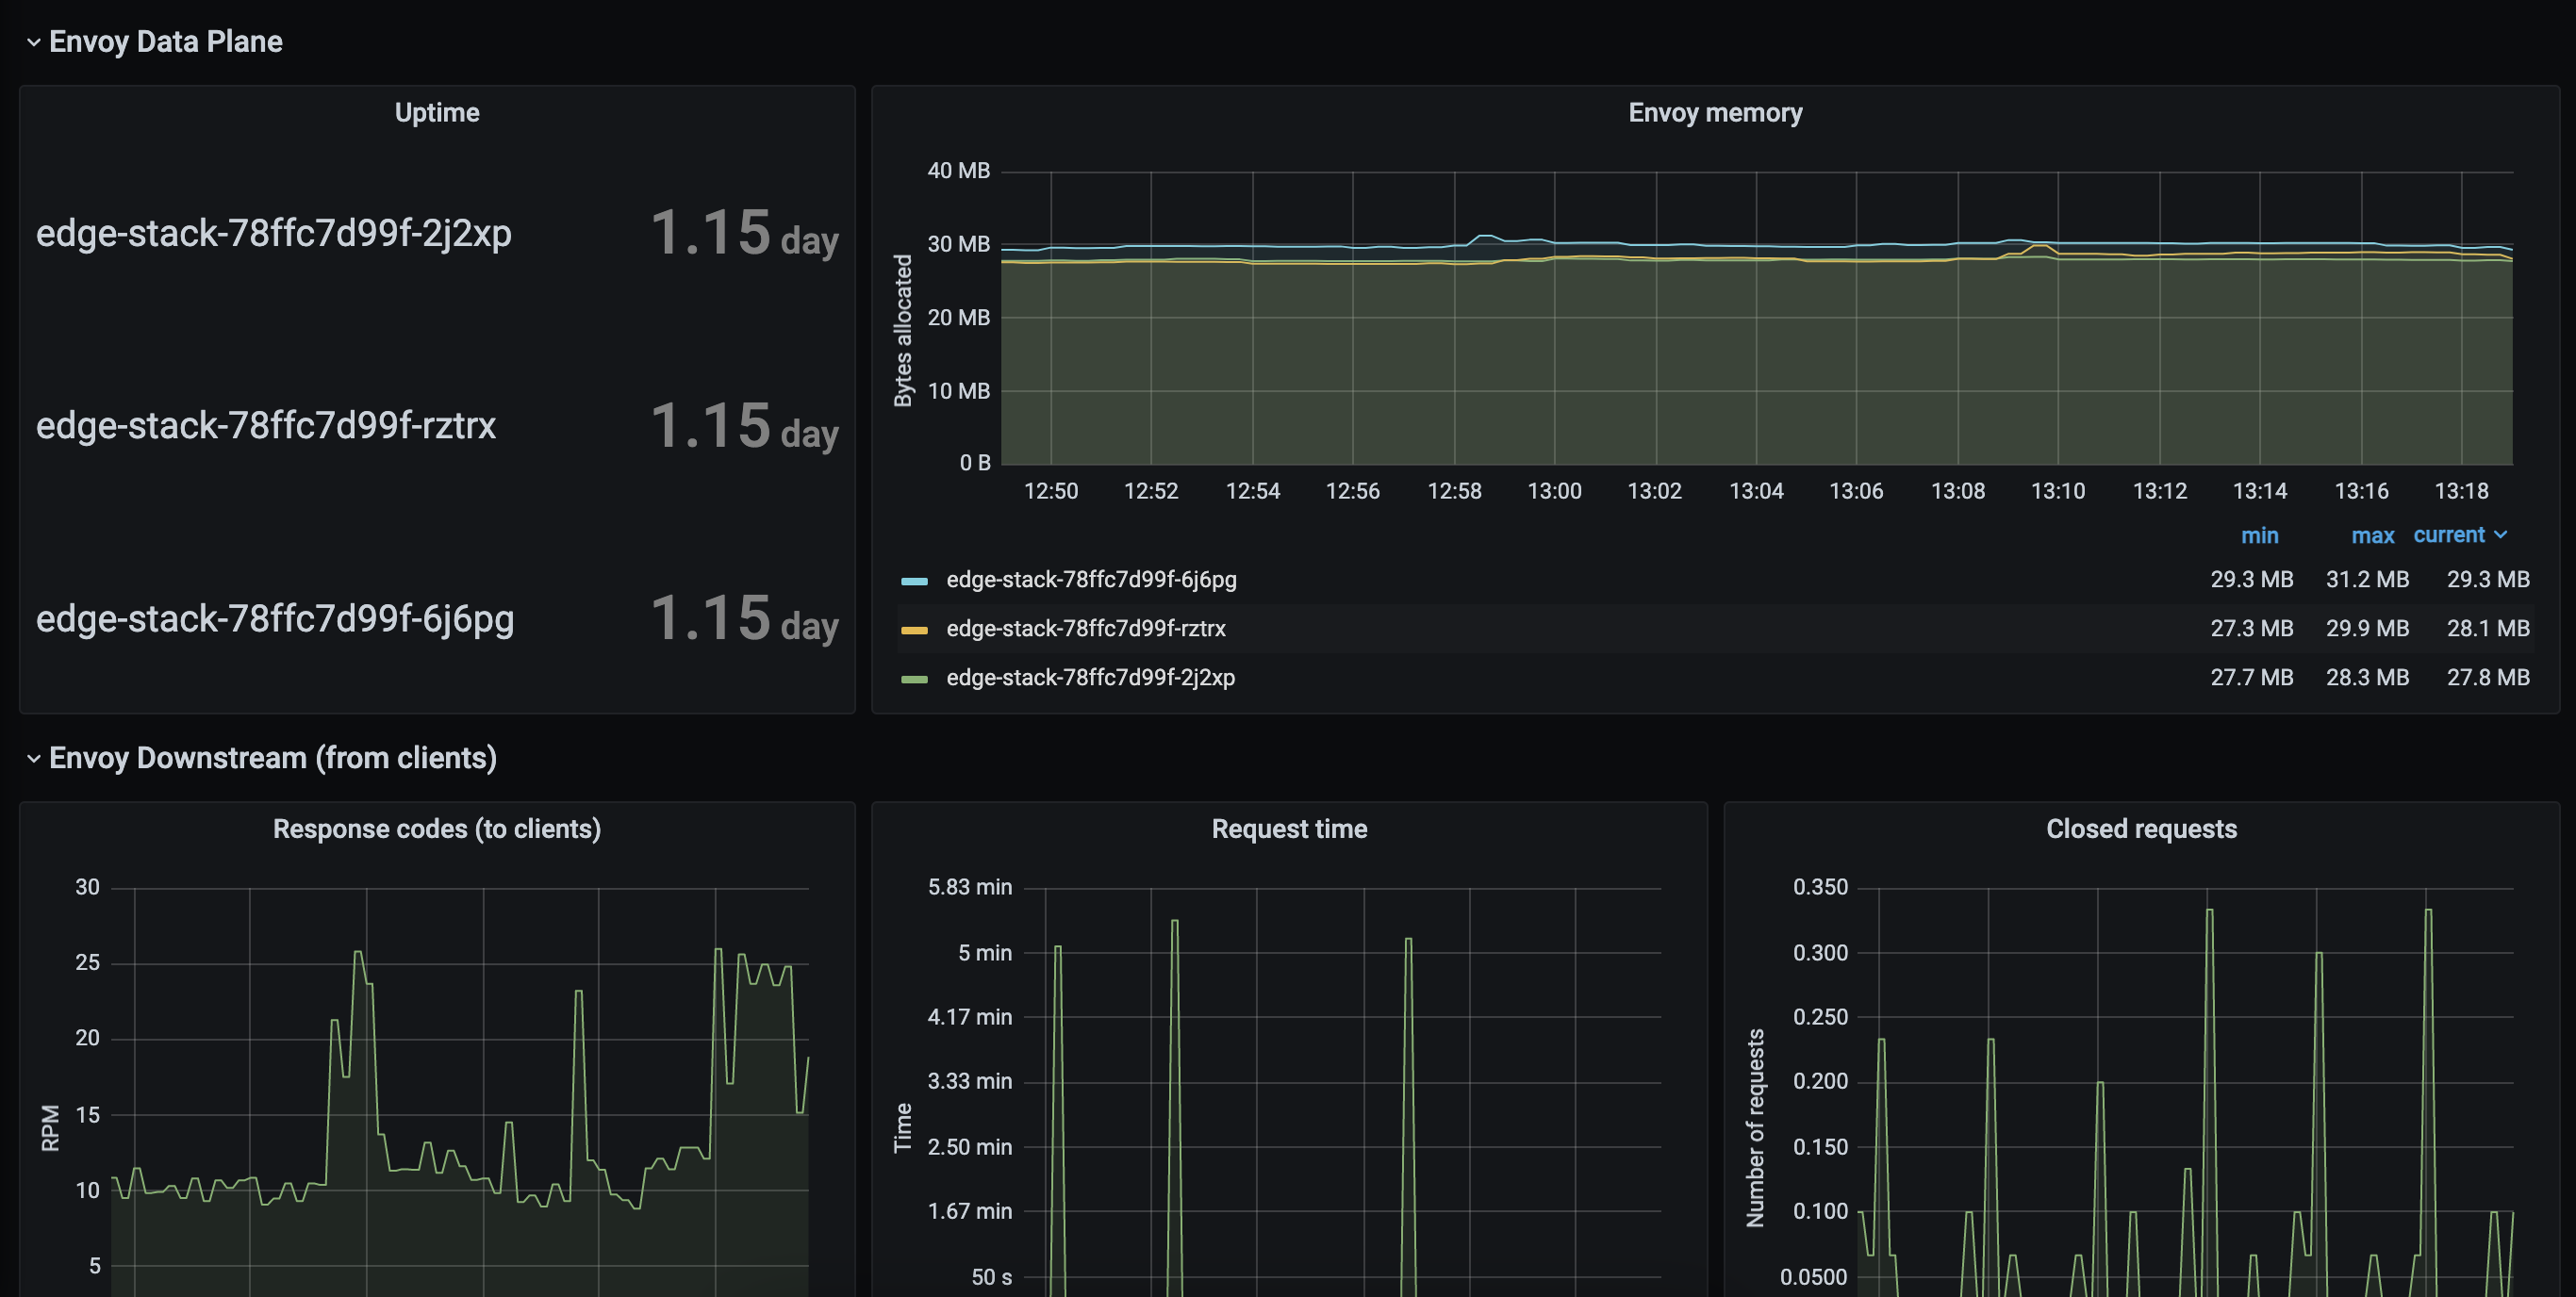
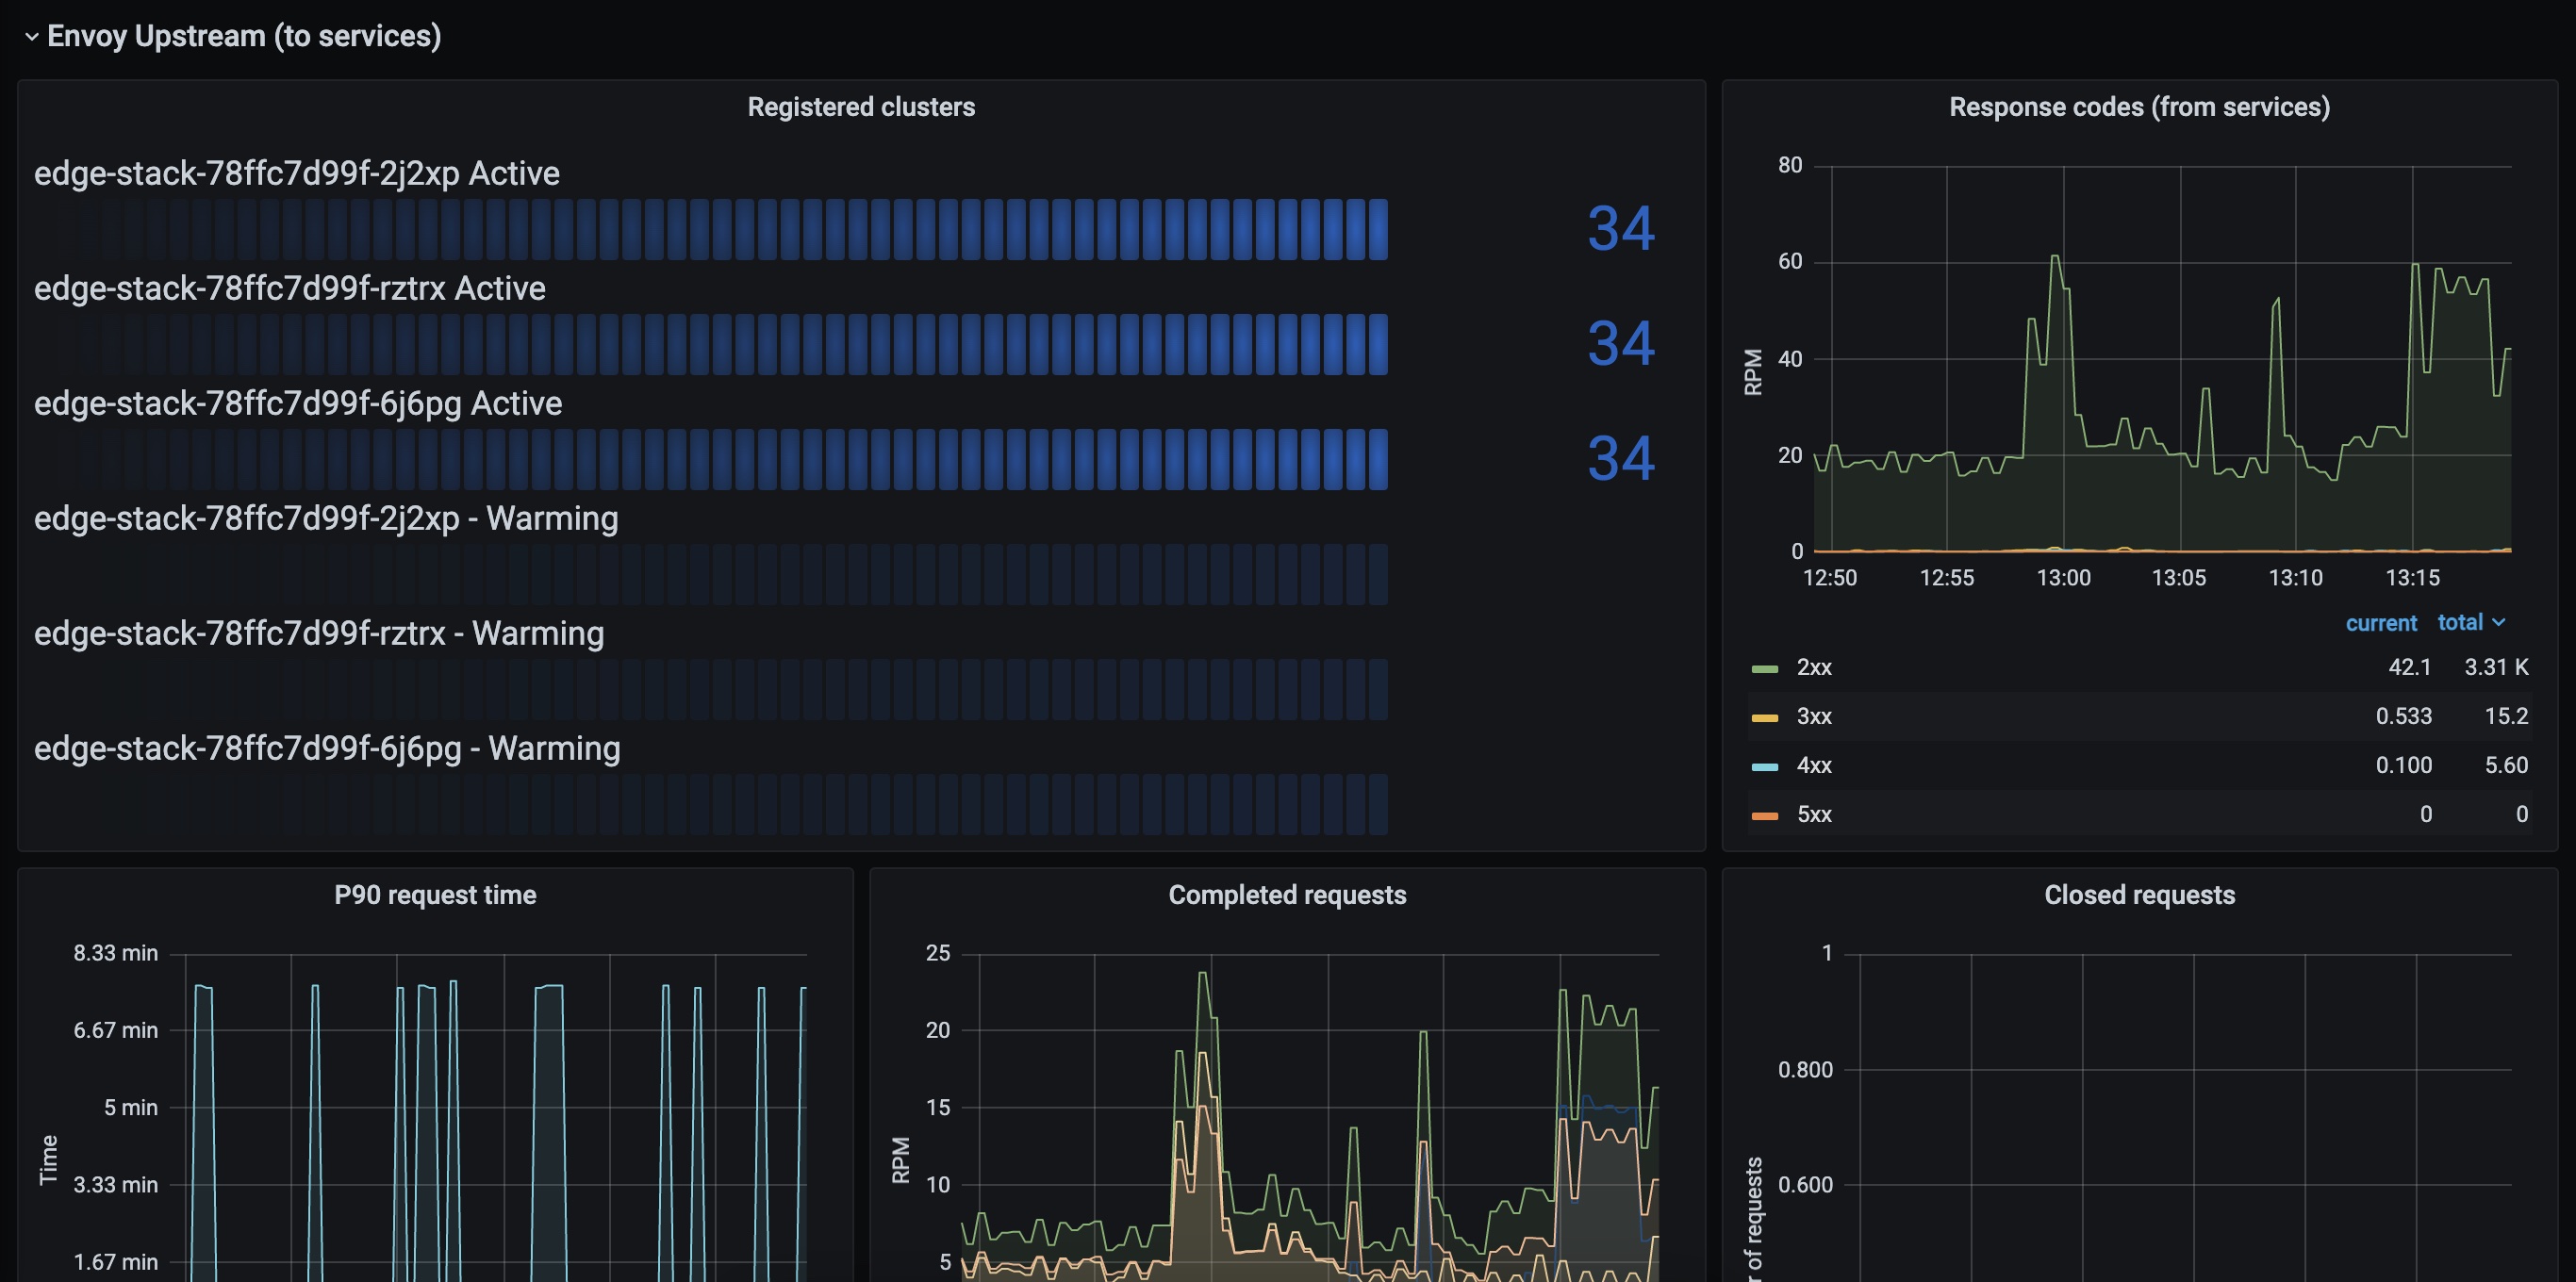
Complete rewrite of the dashboard
- Supports Prometheus data source and metrics format from Ambassador Edge Stack and Emissary-ingress version greater than
2.0. - Divided into 5 sections, with graphs for each component:
- Emissary-ingress Control Plane
- Ambassador Edge Stack
- Envoy Data Plane
- Envoy Downstream (from clients)
- Envoy Upstream (to services)
Revision 4
- Support for both statsd exported metrics and Prometheus scraped
/metricsendpoint for Ambassador version greater than0.71.0. Thanks to @nkrause ! - Removed Tracing and External Rate Limit service graphs
Revision 3
- Added Tracing service stats
- Configurable Prometheus datasource
- Configurable Ambassador Listener port (if not running on port 80)
Revision 2
- Added External Rate Limit service stats
- Requires Grafana 5
Revision 1
- Global API Requests listener
- Downstream connections
- Registered service count
- External Auth service stats
- Grafana 4
Source and revisions:
Data source config
Collector config:
Upload an updated version of an exported dashboard.json file from Grafana
| Revision | Description | Created | |
|---|---|---|---|
| Download |


