Postgres Overview
Performance metrics for Postgres
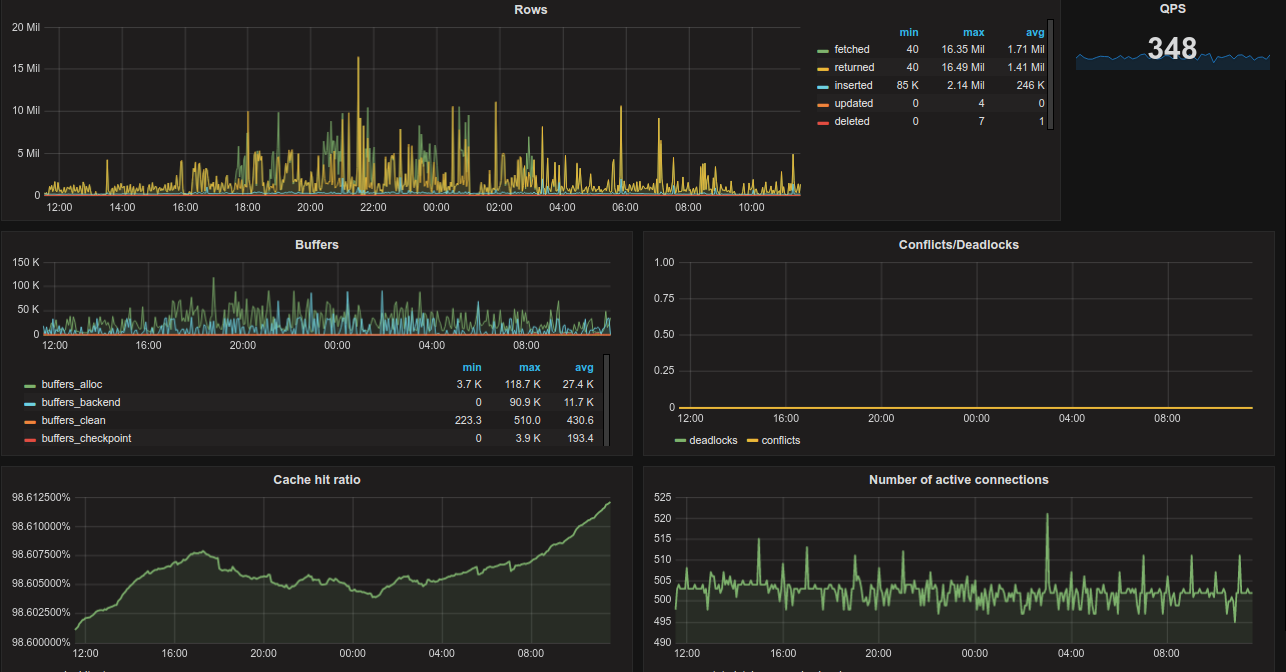
Dashboard allow to monitor:
- rows fetched/returned/inserted/updated/deleted per second
- total qps based on commits and rollbacks
- buffers state
- deadlocks and conflicts graph
- cache hit ratio graph
- number of active connections
The author assumes that the metrics are scraped from various hosts and databases. That's why there are placed two templates: $host and $db. Graphs would change accordingly to selected value.
Requirements: Dashboard is based on the https://github.com/wrouesnel/postgres_exporter metrics
Data source config
Collector type:
Collector plugins:
Collector config:
Revisions
Upload an updated version of an exported dashboard.json file from Grafana
| Revision | Description | Created | |
|---|---|---|---|
| Download |
PostgreSQL
Easily monitor your deployment of PostgreSQL, the open source relational database, with Grafana Cloud's out-of-the-box monitoring solution.
Learn more