Kubernetes App Metrics
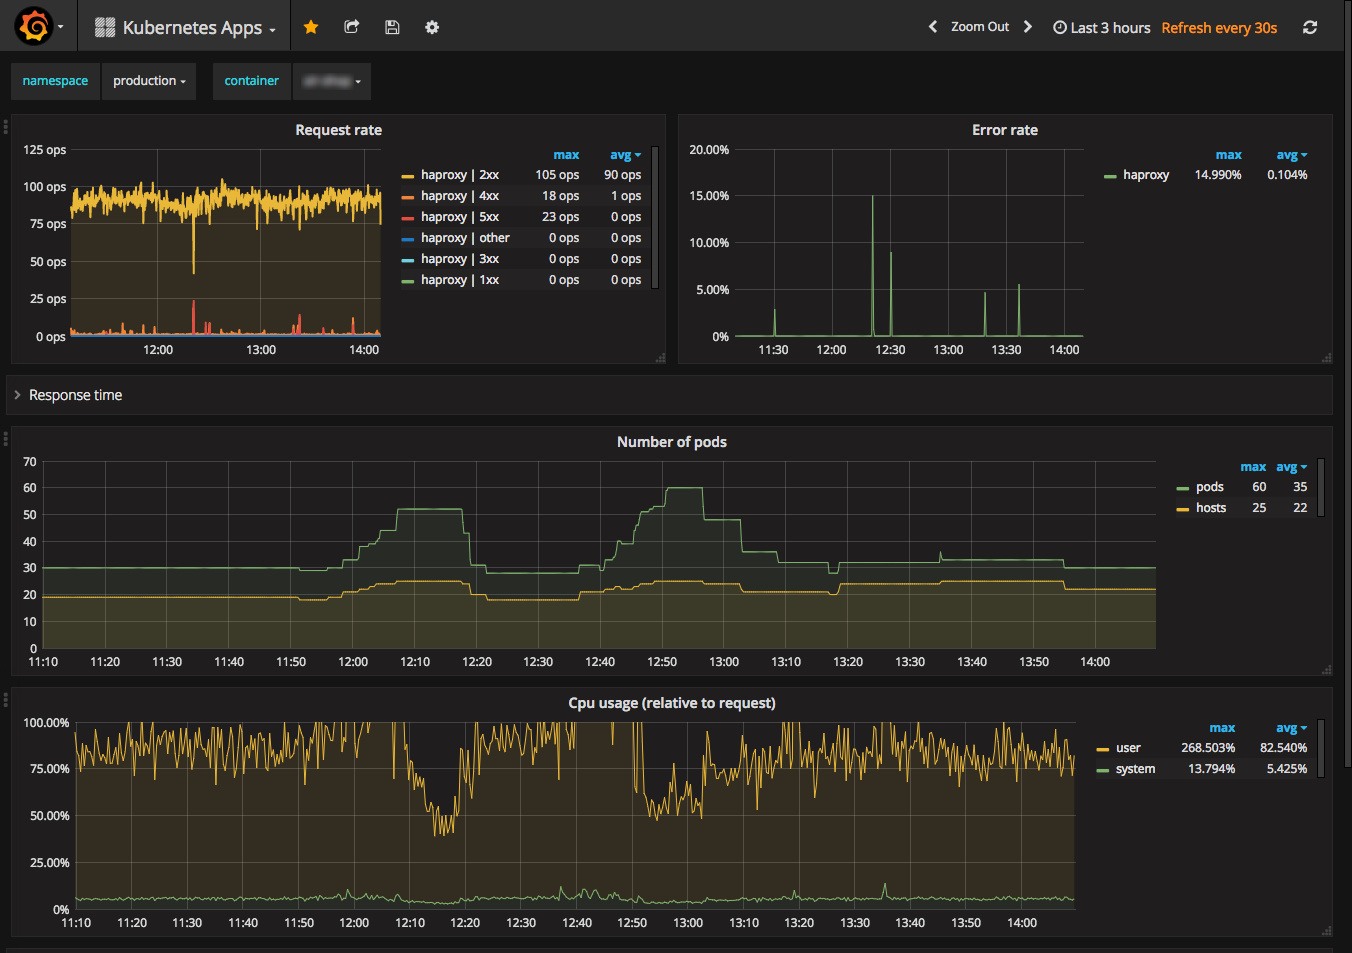
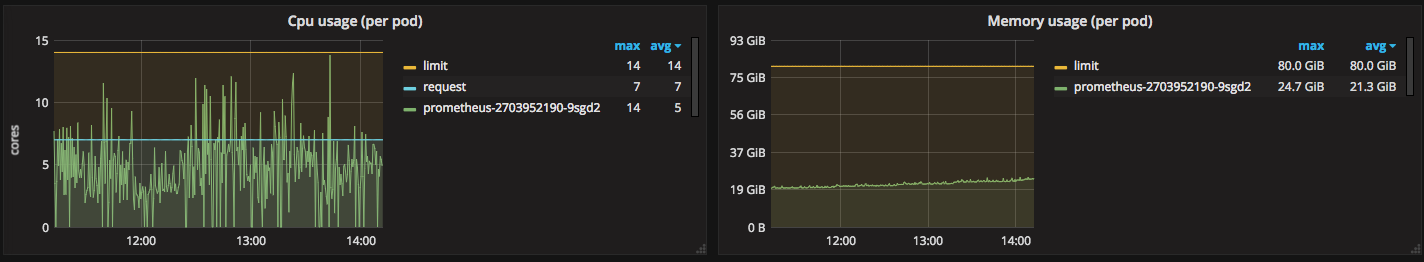
After selecting your namespace and container you get a wealth of metrics like request rate, error rate, response times, pod count, cpu and memory usage. You can view cpu and memory usage in a variety of ways, compared to the limit, compared to the request, per pod, average per pod, etc.
Run Prometheus in your Kubernetes cluster with a configuration like shown at https://github.com/prometheus/prometheus/blob/master/documentation/examples/prometheus-kubernetes.yml. This will make the data used by this dashboard available.
The haproxy stats are exported by running a sidecar container in the haproxy pod. The nginx stats originate from the nginx lua exporter, which runs in the nginx container itself.
Data source config
Collector config:
Upload an updated version of an exported dashboard.json file from Grafana
| Revision | Description | Created | |
|---|---|---|---|
| Download |
Kubernetes
Monitor your Kubernetes deployment with prebuilt visualizations that allow you to drill down from a high-level cluster overview to pod-specific details in minutes.
Learn more